1Beijing National Research Center for Information Science and Technology (BNRist), Department of Electronic Engineering, Tsinghua University, Beijing 100084, China
2State Key Laboratory of Functional Materials for Informatics, Shanghai Institute of Microsystem and Information Technology, Chinese Academy of Sciences, Shanghai 200050, China
3Frontier Science Center for Quantum Information, Beijing 100084, China
4Beijing Academy of Quantum Information Sciences, Beijing 100193, China
Faint light spectroscopy has many important applications such as fluorescence spectroscopy, lidar, and astronomical observations. However, the long measurement time limits its application to real-time measurement. In this work, a photon counting reconstructive spectrometer combining metasurfaces and superconducting nanowire single-photon detectors is proposed. A prototype device was fabricated on a silicon-on-insulator substrate, and its performance was characterized. Experiment results show that this device supports spectral reconstruction of mono-color lights with a resolution of 2 nm in the wavelength region of 1500–1600 nm. Its detection efficiency is 1.4%–3.2% in this wavelength region. The measurement time required by the photon counting reconstructive spectrometer was also investigated experimentally, showing its potential to be applied in scenarios requiring real-time measurement.
1. INTRODUCTION
Since optical spectra have rich information of the interaction between light and matter, spectrometers are widely applied in various fields of science and technology [1]. In many applications, such as fluorescence spectroscopy [2], spectral lidar [3,4], and astronomical observation [5], the measured light is at the single-photon level. Usually, the spectrometer for such faint light is realized by a monochromator and a single-photon detector [3,6,7]. Spectral information is obtained by photon counting when the narrow filter of the monochromator is set at different wavelengths. A long measurement time is required, partly due to its low photon utilization, since only photons in the narrow filter bandwidth are detected under a specific setting of the monochromator, while most photons out of the filter are simply rejected. The scanning process of the monochromator also contributes to the long measurement time. In some applications, high-performance image sensors are used to avoid the scanning process [8,9]. However, since each pixel on the sensor also detects photons only in a very narrow band, a long measurement time is required to achieve a signal to noise ratio high enough. Hence, spectral sensing of ultra-faint light is difficult to apply in scenarios requiring real-time measurement. A long measurement time also means more noise counts would be recorded during measurement.
In recent years, reconstructive spectrometers based on compressive sensing have developed rapidly [10]. They are based on a detector array and optical filters with different complex transmission spectra. The spectral responses of the detectors on the array are modulated by these filters. The spectral information of incident light can be reconstructed by the measurement results of the detectors and their spectral responses. Usually, the number of detectors is far smaller than the sample point number of the spectrum; hence, algorithms of compressive sensing are used to reconstruct the spectrum. Commercial image sensors provide simple and low-cost solutions for detector arrays. Hence, many works focus on materials and structures to realize optical filters, including quantum dots [11], nanowires [12], and metasurfaces [13,14]. Among them, metasurfaces have received much attention in various applications due to their flexible manipulation of input electromagnetic waves [15], such as phase control [16], full-space control [17], and electromagnetically induced transparency [18]. Recently, a real-time ultra-spectral image sensor with over 100,000 pixels based on an image sensor and metasurfaces was reported, showing its potential in developing minimized devices for spectral imaging [19]. We point out that the principle of reconstructive spectrometers also can be applied in scenarios of ultra-faint light. Optical filters in a reconstructive spectrometer have broadband complex transmission spectra, which leads to much higher photon utilization compared with schemes based on monochromators or other narrowband optical filters. It supports “snapshot” measurement without a scanning process since all detectors take photon counting simultaneously. Hence, measurement time is highly reduced by a reconstructive spectrometer of ultra-faint light based on photon counting. The key point of such a device is the way to combine single-photon detectors and optical filters.
Among all the techniques of single-photon detection, the superconducting nanowire single-photon detector (SNSPD) is a good candidate to develop on-chip spectrometers of ultra-faint light [20]. Some intrinsic characteristics of SNSPDs have been applied to realize spectral sensing and analysis, such as the spectral response variation of an SNSPD under different bias currents [21] and the relation between the amplitudes of single-photon events and the wavelengths of detected photons [22]. However, such intrinsic characteristics cannot provide enough freedom to modulate the spectral responses of SNSPDs and support high performance spectral sensing. On the other hand, as an ultra-thin metal wire, the SNSPD is convenient to integrate on a variety of substrates and photonic structures, showing good compatibility with various fabrication processes [23–25]. Two traditional spectrometer devices have been reported, in which an arrayed waveguide grating [26] and a Rowland circle [27] were used to realize spectral response modulation of the SNSPD. Recently, an in-plane disordered scattering structure was introduced to modulate the spectral response of SNSPDs, realizing a single-photon-sensitivity reconstructive spectrometer [28]. These works explored different ways to realize photon counting spectrometers by SNSPDs.
Sign up for Photonics Research TOC. Get the latest issue of Photonics Research delivered right to you!Sign up now
In this work, we propose a photon counting reconstructive spectrometer combining SNSPDs and metasurfaces. In the device, SNSPDs were fabricated on metasurfaces with different structure parameters, which modulated the spectral responses of the SNSPDs, supporting spectral reconstruction by compressive sensing. A prototype device was fabricated and characterized, showing its performance on spectral reconstruction of ultra-faint light and its potential to be applied in scenarios requiring real-time measurement.
2. METHODS
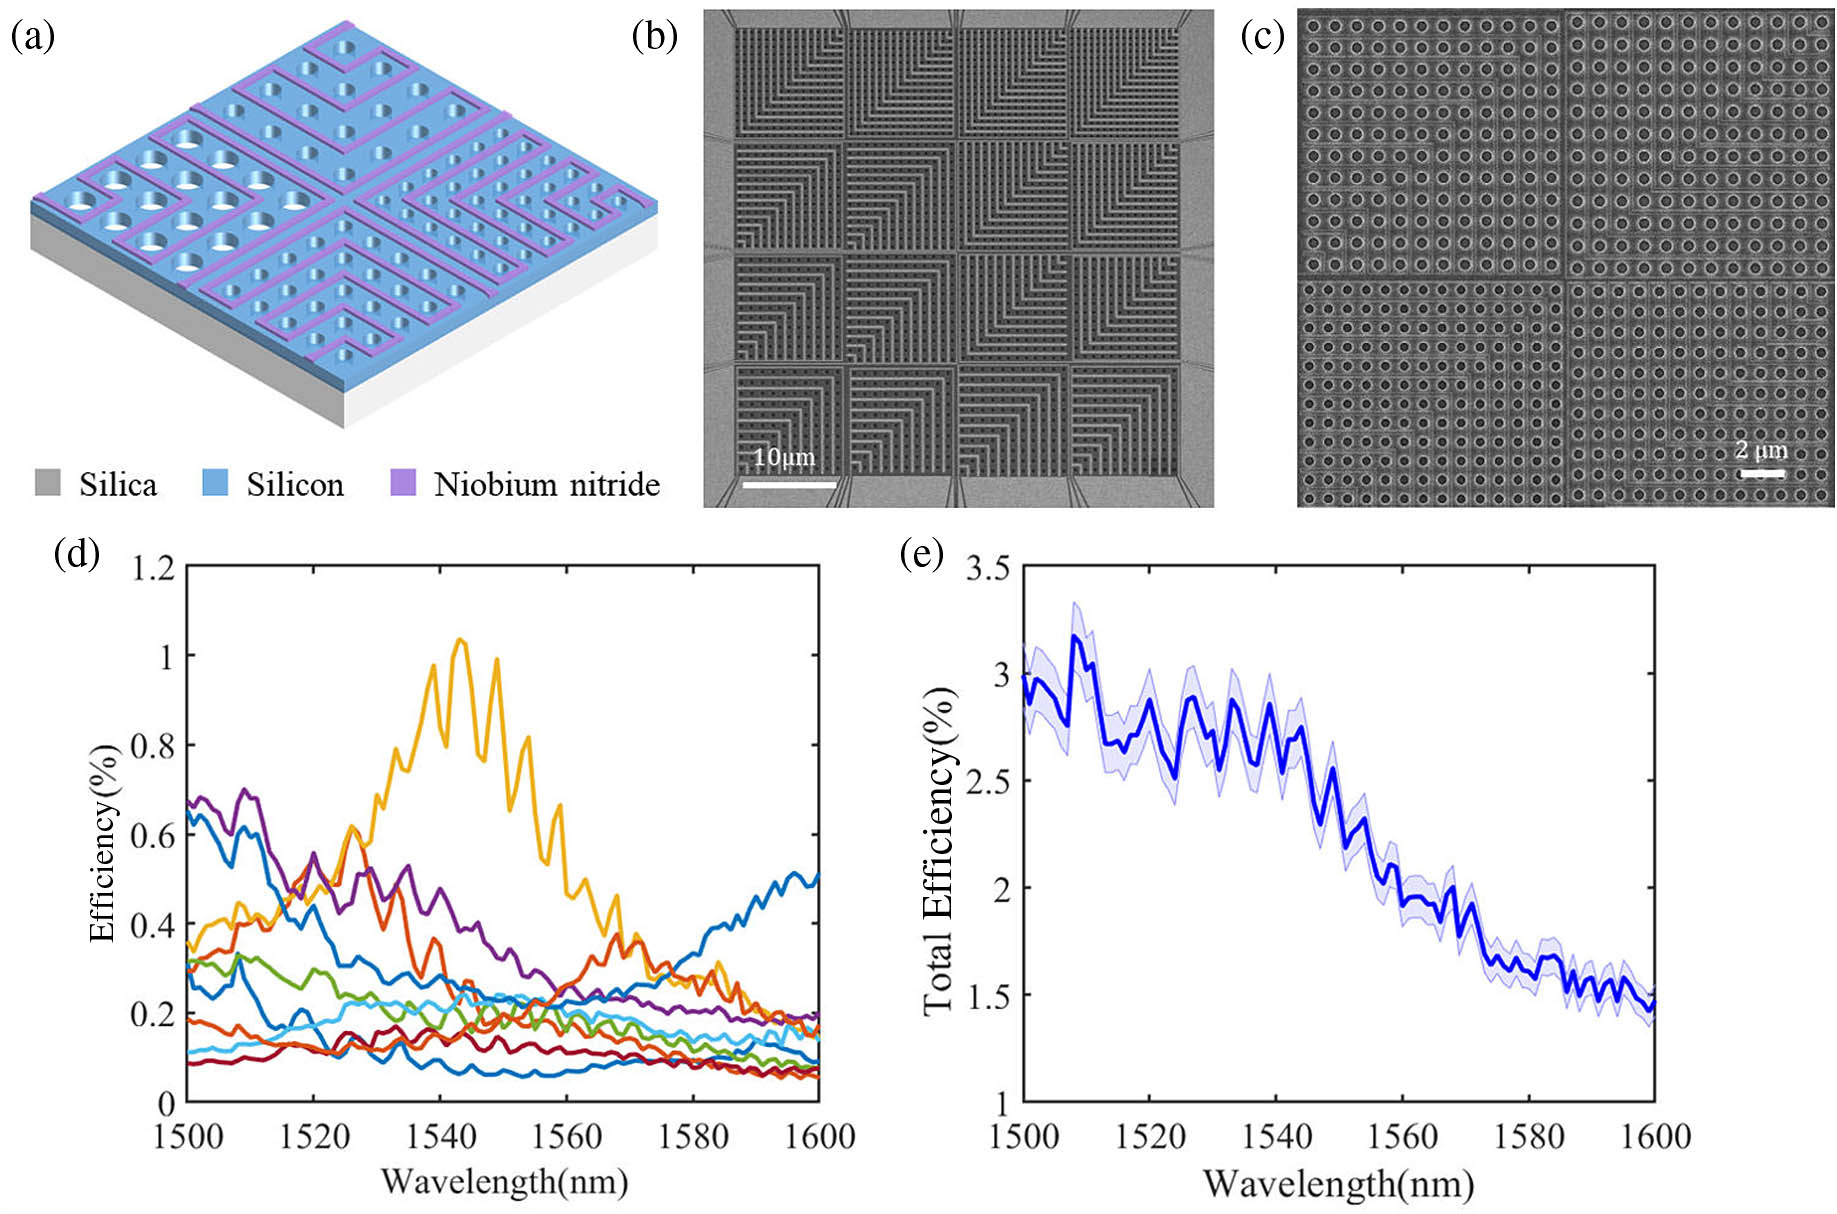
The sketch of the proposed device is shown in Fig. 1(a). It is realized on a substrate with a high-index thin film layer. A metasurface array is fabricated on the thin film layer by etching periodically arranged micro-holes. The metasurface array is divided into many regions, and each has different structure parameters, such as the period and the size of the micro-holes. In each region, an SNSPD is fabricated in the spaces among micro-holes. Hence, the spectral responses of these SNSPDs are modulated by the corresponding metasurfaces, showing complex profiles with low correlation. In this way, each region of the metasurface array becomes a spectral sensing unit with a specific measurement basis.
Figure 1.Sketch of the proposed photon counting reconstructive spectrometer and SEM pictures of the prototype device. (a) Sketch of the spectrometer, which is a metasurface array with SNSPDs in different regions. (b) SEM picture of the full view of the device. (c) SEM picture of four spectral sensing units in the device. (d) Spectral responses of all spectral sensing units. (e) Spectrum of total detection efficiency of this device. The shaded region represents the uncertainty of detection efficiency at each wavelength.
Considering that ultra-faint light with a photon flux density of illuminates devices with spectral sensing units, is the wavelength. evenly spaced sample points are considered in the spectral region for measurement; is the th sample point, and is the interval between two sample points. The photon count number of the th sensing unit in a measurement is denoted by , which can be expressed as where is measurement time, i.e., the time of photon counting. is the spectral response of the SNSPD in the th spectral sensing unit and at the th spectral sample point. They are measured in the calibration process of the device. Usually, the sample point number is far larger than the spectral sensing unit number ; hence, Eq. (1) is an underdetermined linear equation group of . The optimal solution of Eq. (1) can be calculated under certain constraints or prior information, which actually reconstructs the spectrum of input faint light through compressed sensing algorithms [29].
Based on the proposed scheme, we designed and fabricated a prototype device. It was fabricated on a silicon-on-insulator (SOI) substrate with a silicon layer of 340 nm thickness. Niobium nitride (NbN) was deposited on the silicon layer. Then, NbN nanowires were patterned via electron-beam lithography (EBL) and etched by reactive-ion etching (RIE), realizing the fabrication of SNSPDs. The electrodes of the nanowires were also made by the NbN film using UV lithography and an RIE process. Finally, the metasurface array was defined by EBL and etched by inductively coupled plasma RIE (ICP-RIE) at the silicon layer. Figures 1(b) and 1(c) are scanning-electron micrograph (SEM) pictures showing the full view of the device and details of some sensing units on it. The device was mounted in a cryostat under a temperature of 2.1 K and coupled with an optical fiber for optical input.
We measured the spectral responses of all spectral sensing units on the device, obtaining in Eq. (1). The wavelength region of the measurement was 1500–1600 nm, with 101 sample points (, ). Light for the measurement is provided by a tunable laser (Santec TSL-510). It is worth noting that we tried to minimize the polarization dependence of this device by designing the superconducting nanowires in two perpendicular directions in each detection unit, as shown in Figs. 1(a)–1(c). However, the fabricated device still had some polarization dependence. Hence, in the experiment, the input light was controlled to a fixed polarization state in all measurements. Details of the experimental setup and processes are introduced in Appendix A, and the polarization dependence of the device is shown in Appendix B. The measured spectral responses of all sensing units are shown in Fig. 1(d), where it can be seen that the device has nine spectral sensing units in operation. All of them have complex spectral responses, which are different from each other, showing low correlation between any two spectral measurement bases of the device. We also fabricated a sample without metasurfaces, on which only SNSPDs were fabricated. The spectral responses of SNSPDs in this sample were also measured for comparison, and the results are shown in Appendix C, which indicates that the complex spectral responses of the device shown in Fig. 1(d) are due to modulations of metasurfaces with different structure parameters. The total efficiency of this device is calculated by summing the spectral responses of all sensing units, which is shown in Fig. 1(e); it is in a range of 1.4%–3.2% in the wavelength region of measurement, which is comparable to the performance of SNSPDs on similar substrates without reflective or resonance structures [30].
3. RESULTS
A. Spectrometer Characterizations
The performance of the prototype device at telecom band (1500–1600 nm) was demonstrated experimentally. Figure 2(a) shows the spectral reconstruction results when attenuated monochromatic lights at different wavelengths were measured by the device, which were provided by the same tunable laser for device calibration. It shows that the wavelength of the monochromatic light is reconstructed successfully in the whole wavelength region of the measurement. To show the wavelength resolution of the device, two attenuated monochromatic lights with a wavelength difference of 2 nm were generated at different wavelengths by two tunable lasers and measured by the device. The spectral reconstruction results are shown in Fig. 2(b). It suggests that the two monochromatic lights can be discriminated at all wavelength settings, indicating that the device supports a wavelength resolution of 2 nm over the wavelength region of 100 nm.
Figure 2.Spectrometer characterizations from 1500 nm to 1600 nm. (a) Reconstruction results of attenuated monochromatic lights at different wavelengths. (b) Reconstruction results of two monochromatic lights with a wavelength interval of 2 nm at different wavelength settings.
Since SNSPDs have broad wavelength bands of single-photon detection, and metasurfaces also can provide broadband spectral response modulations on SNSPDs, it can be expected that the device can support spectral measurement and reconstruction in a much broader operation band. Hence, we also calibrate the device in a wavelength region of 1350–1629 nm and explore its performance as a spectrometer in such a broad band. The results are shown in Appendix D.
B. Measurement Time Required by the Photon Counting Reconstructive Spectrometer
The performance of spectral reconstruction of this device depends on the photon counts it records. The single-photon events recorded by each spectral sensing unit satisfy Poisson statistics; hence, the photon count number of the th sensing unit () should satisfy Gaussian distribution according to the central limit theorem. The standard deviation of Gaussian distribution is , if the average value of is under a measurement time of . It can be expected that the relative uncertainty of the measured would decrease under an increasing , which is helpful to improve the quality of spectral reconstruction. On the other hand, in principle, the scheme of a reconstructive spectrometer is helpful to save measurement time by enhancing the photon utilization in the measurement of photon counting. It is because the sensing units in the device have complex spectral responses that can detect more photons compared with traditional schemes based on narrow optical filters. Hence, a natural question is, “What is the proper measurement time required by the photon counting reconstructive spectrometer?”
It was investigated by comparing the spectral reconstruction quality of this device under different measurement times. In the experiment, the faint light to be measured was an attenuated broadband light with a Gaussian profile in its spectrum. Its center wavelength and full width at half maximum (FWHM) were 1540 nm and 12 nm, respectively. The single-photon events of all sensing units on the device were recorded in 60 s, showing a total photon count rate of about 29 MHz. For a specific measurement time (), 100 independent time bins with a width of were selected in 60 s. The recorded single-photon events in each time bin were counted to make spectral reconstruction. The quality of the reconstructed spectrum was evaluated by the root mean square error (RMSE), which is defined as , where and are the reconstructed spectrum and actual spectrum of broadband light, respectively. The profile of was measured by an optical spectrum analyzer (OSA) before it was attenuated. The statistics of the RMSE obtained by the data of all these time bins are calculated in Fig. 3. Each point in Fig. 3 shows the average and standard deviation of the RMSE for a specific measurement time , which is the bottom axis of Fig. 3. The corresponding average photon count number is also indicated at the top axis of Fig. 3. Comparisons between the reconstructed spectrum and actual spectrum under different RMSE levels are also shown in Fig. 3. Both the average and standard deviations of the RMSE decrease under increasing measurement time, i.e., the number of single-photon events the device recorded. On the other hand, the main components of the actual spectrum can be reconstructed quite well when the RMSE is smaller than 0.1. Hence, a successful spectral reconstruction can be defined by RMSE in this experiment. A reasonable measurement time should ensure a high possibility that the spectrum reconstruction of a measurement is successful. If this condition is defined by the average RMSE being lower than 0.1 by two standard deviations, the shortest measurement time is about 30 ms. To show the ability of this device in fast measurement, a wavelength sweeping attenuated monochromatic light was measured and the results are introduced in Appendix E. These results show that the device has the potential to be applied in scenarios requiring fast spectral measurement and analysis on single-photon-level faint light.
Figure 3.Statistics of the RMSE of the reconstructed spectrum for a specific broadband light under different measurement time . The upper axis is the average photon counts recorded by the device, which are calculated by and the total photon count rate. Error bar is the standard deviation of the RMSE. Inset images are typical reconstruction results under RMSEs of 0.23, 0.15, 0.10, and 0.05.
In this work, we proposed a photon counting reconstructive spectrometer combining metasurfaces and SNSPDs. SNSPDs were fabricated among the micro-holes of metasurfaces with different structure parameters. Their spectral responses were modulated by corresponding metasurfaces, realizing complex spectral measurement bases with low correlation. The spectrum of incident faint light is reconstructed by compressive sensing. We fabricated a prototype device on an SOI substrate, and characterized its performance in the wavelength region of 1500–1600 nm. Experiment results show that this device supports spectral reconstruction of mono-color lights with a resolution of 2 nm in the wavelength region of 1500–1600 nm. The detection efficiency of this device is 1.4%–3.2% in this wavelength region. It is worth noting that the device can operate in a much broader wavelength region, as shown in Appendix D. The measurement time required by this photon counting reconstructive spectrometer was also investigated experimentally, showing its potential to be applied in scenarios requiring real-time measurement.
In Appendix F, a comparison between the device performance in this work and those in previous works on integrated photon counting spectrometers based on SNSPDs is provided. All device schemes shown in Table 1 (Appendix F) have large spaces to be improved. For the device of this work, better performance could be expected if the detection efficiency could be enhanced by improving the fabrication process [31] and the substrate [32]. Moreover, the fractal superconducting nanowire design could be an alternative to minimize polarization dependence [33]. Optimization of spectral measurement bases and the spectral reconstruction algorithm would also highly improve the performance of the proposed device.
Acknowledgment
Acknowledgment. We thank PHOTEC for help with the cryostat assembly and testing.
APPENDIX A: SPECTRAL RESPONSE CALIBRATION OF THE PROTOTYPE DEVICE
The prototype device was mounted in a cryostat under a temperature of 2.1 K. The ultra-faint light to be measured was coupled to the device through a single-mode fiber. Figure 4(a) shows the experiment setup of the spectral response calibration of the device. The attenuated monochromatic light at each sample point was generated from a tunable laser (Santec TSL-510) and attenuated by a pair of tunable attenuators (Keysight 81571A). Then, it connected to the input port of an optical switch (Thorlabs OSW12-1310E). The optical switch had two output ports. One of them connected to a calibrated optical power meter (Thorlabs S154C and PM100D), and the other connected to the polarization control part including a fiber polarization controller and a fiber polarization beam splitter. Then, the light was coupled to the device by a single-mode fiber. The polarization control part ensures that the light illuminates the device under a fixed polarization state, removing the impact of polarization dependence. The SNSPD of each spectral sensing unit in the device was supported by an independent circuit, which provided its bias current. The circuit also coupled out its output signal to a channel of a streaming time-to-digital converter (Swabian Instruments TimeTagger), which recorded the photon counts of this SNSPD.
Figure 4.(a) Schematic diagram of the experimental setup of the spectral response calibration. (b) Photon count rates of the device in 1 h.
The photon flux of the attenuated monochromatic light was calculated by the measured power and the settings of the two attenuators. To reduce the uncertainty of the calibration process, we measured the detection efficiency of the SNSPD in each sensing unit at a specific frequency sample point in the following steps [31]. System.Xml.XmlElementSystem.Xml.XmlElementSystem.Xml.XmlElementSystem.Xml.XmlElementSystem.Xml.XmlElement
The spectral responses of all sensing units in the device were obtained when their detection efficiencies at all wavelength sample points were measured. The total efficiency spectrum of the device was calculated by summing the spectral responses of all sensing units.
According to Eq. (A1), the uncertainty of the detection response calibration process had two contributions.
One was the uncertainty of the measured photon count rates of the SNSPDs [ in Eq. (A1)], which was determined by the stability of the laser source in the experiments and Poisson statistics of the photon counting. To show the uncertainty of this contribution, we took the photon counting of the calibration process at 1550 nm repeatedly in 1 h. The results of photon count rates of all units are shown in Fig. 4(b). The measured was stable for all detection units with a small uncertainty less than .
Another contribution was from the optical power measurements in the calibration process [, , and in Eq. (A1)]. The results of Fig. 4(b) show that the light source of the experiment was very stable. The repeatability of the attenuators (Keysight 81571A; repeatability 0.01 dB) and the optical switch (Thorlabs OSW12-1310 E) was also quite good. The uncertainty of the optical power measurements was mainly from the uncertainty of the non-ideal calibration of the optical power meter (Thorlabs, S154C; uncertainty ). This uncertainty was a deviation between the measured power value and its real value, which is unknown but fixed at each wavelength sample point. Hence, the uncertainty of was also about , because the fixed deviation at the numerator was compensated for by one term of the denominator.
Since the contribution from the optical power measurements was much larger than that from the photon counting, the uncertainty of the detection responses was mainly determined by the former one, leading to a value of about .
The total detection efficiency of the device was the sum of the detection responses of all detection units. It can be expected that the measured spectral responses of all units had similar deviations from their real values, which were determined by the non-ideal calibration of the optical power meter. As a result, the uncertainty of total detection efficiency was also about .
APPENDIX B: POLARIZATION DEPENDENCE OF THE PROTOTYPE DEVICE
To show the polarization dependence of this device, we removed the polarization beam splitter in Fig. 4(a) and measured the spectral responses of all detection units under different input light polarization states. The input light polarization was adjusted by the fiber polarization controller. Figure 5 shows the measured spectral responses of all detection units with two typical polarization light inputs, under which the device achieves its maximum and minimum detection efficiency at 1550 nm. The spectral responses under different input light polarizations showed similar profiles; however, the differences between them were also obvious in most units. It can be expected that the polarization dependence shown here would highly impact the results of spectral reconstruction. Hence, in this work, the device was measured under a fixed input light polarization, which was determined by the polarization beam splitter in the measurement setup shown in Fig. 4(a).
Figure 5.Spectral responses of different detection units under two different polarizations. Blue and orange lines show the results under two different input polarization states, under which the device achieves its maximum and minimum detection efficiencies at 1550 nm, respectively.
APPENDIX C: SPECTRAL RESPONSES OF SNSPDS IN THE SAMPLE WITHOUT METASURFACES
To show the effect of metasurfaces in the proposed photon counting reconstructive spectrometer, we also fabricated a sample without metasurfaces. Only SNSPDs were fabricated on the sample with the same structure parameters as those of the prototype device. We measured the spectral responses of SNSPDs in this sample for comparison. Figure 6(a) is the SEM picture of the sample. The measured spectral responses of different SNSPDs are shown in Fig. 6(b). Compared with the results of the prototype device shown in Fig. 6(a), it is obvious that the spectral responses of this sample are quite similar to each other, which indicates that the complex spectral responses of the prototype device are caused by the metasurfaces, which is fundamental for the spectral reconstruction performance. As shown in Fig. 6(c), the total efficiency of the sample without metasurfaces is in a range of 0.8% to 2.7%, which is smaller than that of the prototype device. It indicates that the enhancement of local light field intensity introduced by metasurfaces is also beneficial to enhance the absorption of SNSPDs, leading to an improvement in detection efficiencies. Considering that only nine SNSPDs were active in the prototype device, while 16 SNSPDs of the sample without metasurfaces were all active, the effect of efficiency improvement of the metasurfaces is quite obvious.
Figure 6.Spectral responses of SNSPDs in the sample without metasurfaces. (a) SEM picture of the sample. (b) Spectral responses of the SNSPDs. (c) Total efficiency of the sample.
APPENDIX D: SPECTROMETER CHARACTERIZATION IN THE WAVELENGTH REGION FROM 1350?nm TO 1629?nm
The attenuated monochromatic light in the wavelength region from 1350 nm to 1629 nm was generated by a tunable laser (Santec TSL-210F) and also attenuated by cascaded tunable attenuators. The total number of wavelength sample points was 93, with a wavelength interval of 3 nm. According to the calibration method introduced in Appendix A, the spectral responses of the sensing units in this wavelength region were measured, and are shown in Fig. 7(a). The total efficiency spectrum of the device is shown in Fig. 7(b). It can be seen that the total efficiency is in the range of 1.1% to 4.4%.
Figure 7.Spectrometer characterizations from 1350 nm to 1629 nm. (a) Spectral responses of each spectral sensing unit. (b) Total detection efficiency spectrum of the device. The shaded region represents the uncertainty of detection efficiency at each wavelength. (c) Reconstruction results of attenuated monochromatic lights at different wavelengths. (d) Typical reconstruction result of an attenuated broadband light provided by an EDF ASE source. (e)–(h) Reconstruction results of two monochromatic lights near 1550 nm with wavelength intervals of 6 nm, 9 nm, 12 nm, and 15 nm, respectively.
The performance of spectral sensing and reconstruction in this wavelength region was also demonstrated experimentally. Figure 7(c) shows the spectral reconstruction results when attenuated monochromatic lights at different wavelengths were measured by the device. It can be seen that the central wavelength of the monochromatic light can be reconstructed successfully over the whole measurement wavelength region. Figure 7(d) is a typical spectral reconstruction result when attenuated broadband light was measured, which was provided by an amplified spontaneous emission (ASE) source based on a piece of erbium-doped fiber (EDF). It clearly shows that the main spectral components of broadband light can be obtained by this device. To show its wavelength resolution, two attenuated monochromatic lights with wavelength differences of 6 nm, 9 nm, 12 nm, and 15 nm are provided near 1550 nm. The spectral reconstruction results of this device are shown in Figs. 7(e)–7(h), respectively. It can be seen that the two monochromatic lights can be discriminated in all cases.
APPENDIX E: FAST SPECTRAL MEASUREMENT OF SWEEPING MONOCHROMATIC FAINT LIGHT
To show the ability of this device in fast measurement, an attenuated monochromatic light with its wavelength sweeping from 1547 nm to 1554 nm was generated by the tunable laser (Santec TSL510F). Its wavelength varied with increasing time as shown in Fig. 8(a). It shows that the wavelength increased by 1 nm after a time interval of , which could be adjusted by setting the tunable laser. The photon flux of the attenuated monochromatic light was set to support a counting rate of about 17.55 MHz detected by the device. Each time interval of was divided into 10 time bins, and the spectral reconstructions were achieved based on the data of single-photon events recorded in these time bins. Hence, the dynamic variation of the spectrum was measured under a sampling time interval of , which was 1/10 of .
Photon Counting Spectrometers Based on SNSPDs at Telecom Band
Reference
Detection Efficiency
Wavelength Range at Telecom Band
Resolution
[21]
1480–1640 nm
6 nm at 1550 nm
[27]
0.1%
1420–1680 nm
2.5 nm at 1550 nm
[28]
1530–1580 nm
4 nm at 1550 nm
[34]
1.8%–4.75%
1200–1700 nm
5 nm at 1330 nm
This work
1.1%–4.4% at 1350–1629 nm
1500–1600 nm, 1350–1629 nm
2 nm at 1500–1600 nm
Figure 8.Experiment results of fast spectral measurement. (a) Schematic sketch of the temporal wavelength variation of the attenuated monochromatic light. (b)–(d) Reconstructed spectra measured under different settings of and when the wavelength of the attenuated monochromatic light sweeps from 1547 nm to 1554 nm. (b) and ; (c) and ; (d) and .
In the experiment, was set to 1 s, 0.5 s, and 0.2 s, with corresponding of 100 ms, 50 ms, and 20 ms, respectively. The results of the dynamic spectral reconstruction spectra under these settings of and are shown in Figs. 8(b)–8(d), respectively. In these figures, the and axes represent time and wavelength, respectively. The color bars show the normalized intensity of the reconstructed spectra. These results show that the reconstructed spectra agree with the laser setting quite well, showing the temporal wavelength variation of the attenuated monochromatic light in all cases. On the other hand, it can be seen that the quality of spectral reconstruction shows a little decline when reduces from 100 ms to 20 ms. It is because a smaller leads to smaller photon counts of the SNSPDs in the spectral sensing units. Higher uncertainty could be expected under a smaller due to the Gaussian statistics of the photon counting, which would impact the quality of spectral reconstruction. This experiment shows that the device can support a fast spectral reconstruction with a measurement time of 10–100 ms, under a photon counting rate of .
APPENDIX F: PERFORMANCE COMPARISON OF PHOTON COUNTING SPECTROMETERS BASED ON SNSPDS AT TELECOM BAND
A performance comparison between this work and pervious works on a photon counting spectrometer based on SNSPDs is shown in Table 1. Here, we focus on the performance at telecom band.