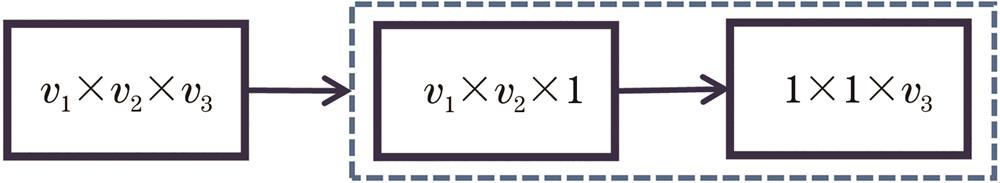
Fig. 1. Modified three-dimensional convolution module
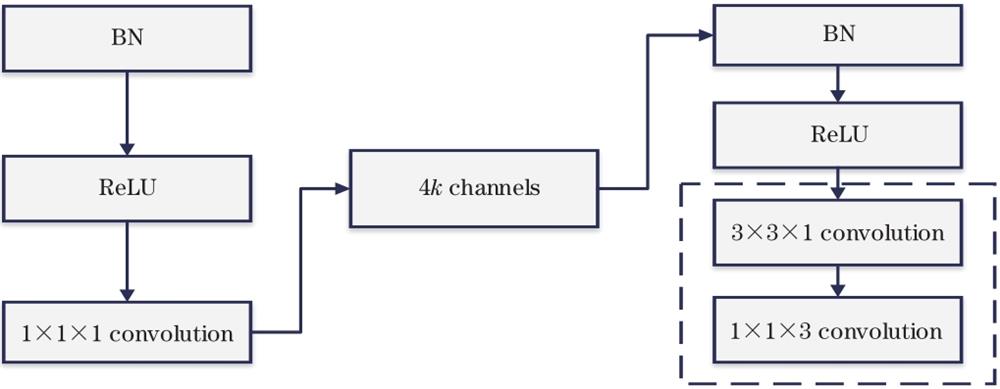
Fig. 2. Structure of the modified Dense_Layer
Fig. 3. Model of the spatial spectrum attention mechanism. (a) Channel attention mechanism; (b) spatial attention mechanism
Fig. 4. Structure of the Dense_Layer
Fig. 5. Structure of the MDSSAN model
Fig. 6. Indian Pines data set and label. (a) Indian Pines data set; (b) label
Fig. 7. Pavia University data set and label. (a) Pavia University data set; (b) label
Fig. 8. KSC data set and label. (a) KSC data set; (b) label
Fig. 9. Classification results of the Indian Pines data set. (a) Indian Pines data set; (b) label; (c) 2D_CNN; (d) 3D_CNN; (e) M3RCNN; (f) 3D_DenseNet; (g) MDSSAN
Fig. 10. Classification results of the Pavia University data set. (a) Pavia University data set; (b) label; (c) 2D_CNN;(d) 3D_CNN; (e) M3RCNN; (f) 3D_DenseNet; (g) MDSSAN
Fig. 11. Classification result diagram of the KSC data set. (a) KSC data set; (b) label; (c) 2D_CNN; (d) 3D_CNN; (e) M3RCNN; (f) 3D_DenseNet; (g) MDSSAN
| No. | Category | Training set | Verification set | Test set |
|---|
| Total | 2164 | 1182 | 7311 | | 1 | alfalfa | 11 | 4 | 34 | | 2 | corn-notill | 284 | 141 | 1009 | | 3 | corn-min | 167 | 100 | 572 | | 4 | corn | 58 | 28 | 163 | | 5 | grass/pasture | 103 | 75 | 320 | | 6 | grass/trees | 148 | 70 | 530 | | 7 | grass/pasture-mowed | 13 | 11 | 25 | | 8 | hay-windrowed | 106 | 51 | 345 | | 9 | oats | 12 | 12 | 23 | | 10 | soybeans-notill | 202 | 111 | 689 | | 11 | soybeans-min | 509 | 242 | 1737 | | 12 | soybeans-clean | 126 | 73 | 430 | | 13 | wheat | 55 | 26 | 163 | | 14 | woods | 250 | 155 | 902 | | 15 | building-grass-trees-drives | 85 | 55 | 291 | | 16 | stone-steel towers | 35 | 28 | 78 |
|
Table 1. Number of samples of training set, verification set and test set selected from Indian Pines data set
| No. | Category | Training set | Verification set | Test set |
|---|
| Total | 8514 | 4408 | 29989 | | 1 | asphalt | 1306 | 691 | 4637 | | 2 | meadows | 3730 | 1902 | 13023 | | 3 | gravel | 400 | 225 | 1483 | | 4 | trees | 626 | 336 | 2114 | | 5 | sheets | 244 | 155 | 961 | | 6 | bare soil | 1033 | 474 | 3540 | | 7 | bitumen | 282 | 128 | 941 | | 8 | bricks | 714 | 405 | 2587 | | 9 | shadows | 179 | 92 | 703 |
|
Table 2. Number of samples of training set, verification set and test set selected from Pavia University data set
| No. | Category | Training set | Verification set | Test set |
|---|
| Total | 1122 | 623 | 3739 | | 1 | scrub | 172 | 70 | 522 | | 2 | willow swamp | 50 | 32 | 167 | | 3 | camping hammock | 52 | 28 | 185 | | 4 | slash pine | 66 | 26 | 172 | | 5 | oak/broadleaf | 39 | 19 | 118 | | 6 | hardwood | 49 | 32 | 166 | | 7 | swap | 23 | 24 | 79 | | 8 | graminoid marsh | 81 | 62 | 312 | | 9 | spartina marsh | 106 | 55 | 386 | | 10 | cattail marsh | 88 | 44 | 302 | | 11 | salt marsh | 90 | 58 | 304 | | 12 | mud flats | 103 | 66 | 370 | | 13 | water | 203 | 107 | 656 |
|
Table 3. Number of samples of training set, verification set and test set selected from KSC data set
| Classification | 2D_CNN | 3D_CNN | M3RCNN | 3D_DenseNet | MDSSAN |
|---|
| Alfalfa /% | 93.48 | 100.00 | 71.74 | 97.83 | 97.83 | | Corn-notill /% | 95.87 | 99.86 | 85.92 | 95.59 | 98.32 | | Corn-min /% | 93.13 | 90.84 | 93.86 | 100.00 | 99.76 | | Corn /% | 92.83 | 94.09 | 92.41 | 99.58 | 100.00 | | Grass/pasture /% | 81.78 | 98.55 | 93.37 | 95.65 | 99.79 | | Grass/trees /% | 98.49 | 98.77 | 98.49 | 99.73 | 99.86 | | Grass/pasture-mowed /% | 89.29 | 100.00 | 100.00 | 100.00 | 100.00 | | Hay-windrowed /% | 99.58 | 100.00 | 100.00 | 100.00 | 100.00 | | Oats /% | 90.00 | 85.00 | 55.00 | 40.00 | 80.00 | | Soybeans-notill /% | 95.88 | 89.51 | 83.54 | 99.59 | 99.38 | | Soybeans-min /% | 98.21 | 83.95 | 97.84 | 99.96 | 99.76 | | Soybeans-clean /% | 96.46 | 98.48 | 93.76 | 97.64 | 99.49 | | Wheat /% | 98.05 | 100.00 | 99.51 | 94.15 | 100.00 | | Woods /% | 99.60 | 99.60 | 98.97 | 99.45 | 99.92 | | Building-grass-trees-drives /% | 97.93 | 98.19 | 97.15 | 99.22 | 98.45 | | Stone-steel towers /% | 97.85 | 98.92 | 82.80 | 96.77 | 96.77 | | OA /% | 96.43 | 93.86 | 93.89 | 98.59 | 99.43 | | AA /% | 94.90 | 95.99 | 90.27 | 94.70 | 98.08 | | Kappa coefficient | 95.93 | 93.03 | 93.01 | 98.40 | 99.35 | | Time /min | 1.89 | 5.38 | 32.27 | 18.07 | 12.43 |
|
Table 4. Classification results of the Indian Pines data set
| Classification | 2D_CNN | 3D_CNN | M3RCNN | 3D_DenseNet | MDSSAN |
|---|
| Asphalt /% | 98.97 | 99.40 | 99.26 | 98.66 | 99.82 | | Meadows /% | 99.43 | 99.65 | 99.98 | 99.92 | 99.96 | | Gravel /% | 97.28 | 94.33 | 97.14 | 99.29 | 97.76 | | Trees /% | 99.71 | 97.78 | 99.61 | 98.47 | 99.45 | | Sheets /% | 99.70 | 98.88 | 100.00 | 100.00 | 99.93 | | Baresoil /% | 99.64 | 99.98 | 87.09 | 100.00 | 99.96 | | Bitumen /% | 84.21 | 98.87 | 98.87 | 99.02 | 99.32 | | Bricks /% | 97.91 | 99.35 | 99.57 | 100.00 | 99.78 | | Shadows /% | 91.66 | 99.89 | 100.00 | 97.99 | 99.37 | | OA /% | 98.53 | 99.18 | 98.12 | 99.54 | 99.74 | | AA /% | 96.50 | 98.68 | 97.95 | 99.26 | 99.48 | | Kappa coefficient | 98.05 | 98.92 | 97.49 | 99.39 | 99.66 | | Time /min | 6.61 | 7.21 | 73.92 | 76.10 | 19.58 |
|
Table 5. Classification results of the Pavia University data set
| Classification | 2D_CNN | 3D_CNN | M3RCNN | 3D_DenseNet | MDSSAN |
|---|
| Scrub /% | 97.77 | 99.74 | 99.74 | 98.16 | 100.00 | | Willow swamp /% | 78.60 | 99.18 | 93.42 | 88.48 | 95.06 | | CP hammock /% | 87.89 | 93.75 | 98.83 | 98.83 | 100.00 | | Slash pine /% | 70.24 | 58.33 | 86.51 | 88.89 | 95.24 | | Oak/broadleaf /% | 78.88 | 80.12 | 85.09 | 93.17 | 93.79 | | Hardwood /% | 93.89 | 80.34 | 93.01 | 92.14 | 100.00 | | Swap /% | 98.10 | 78.10 | 97.14 | 100.00 | 100.00 | | Graminoid marsh /% | 89.33 | 99.54 | 98.84 | 99.07 | 98.84 | | Spartina marsh /% | 90.77 | 98.65 | 100.00 | 99.81 | 99.62 | | Cattail marsh /% | 90.84 | 99.26 | 100.00 | 100.00 | 98.51 | | Salt marsh /% | 99.76 | 100.00 | 99.52 | 99.76 | 100.00 | | Mud flats /% | 99.40 | 97.02 | 94.63 | 97.22 | 98.81 | | Water /% | 99.89 | 100.00 | 99.89 | 100.00 | 100.00 | | OA /% | 93.07 | 95.16 | 97.45 | 97.66 | 98.98 | | AA /% | 90.41 | 91.08 | 95.89 | 96.58 | 98.45 | | Kappa coefficient | 92.28 | 94.61 | 97.16 | 97.39 | 98.87 | | Time /min | 1.11 | 1.74 | 18.04 | 11.25 | 8.19 |
|
Table 6. Classification results of the KSC data set
| Data set | Model parameter | OA/% |
|---|
| Before improvement | After improvement | Before improvement | After improvement |
|---|
| Indian Pines | 1186044 | 565167 | 98.70 | 99.43 | | Pavia University | 1184749 | 563872 | 99.17 | 99.74 | | KSC | 1185489 | 564612 | 95.93 | 98.98 |
|
Table 7. Effect of three-dimensional convolution module before and after the improvement