Author Affiliations
1School of Mechanical Engineering, Shaanxi University of Technology, Hanzhong , Shaanxi 723001, China2Shaanxi Key Laboratory of Industrial Automation, Hanzhong , Shaanxi 723001, Chinashow less
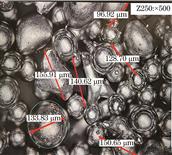
Fig. 1. Morphology of non-uniform Fe45 powder
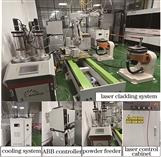
Fig. 2. Test equipment
Fig. 3. Definition of cross-sectional area
Fig. 4. Macro morphology of single pass laser cladding
Fig. 5. Morphologies of cladding layer
Fig. 6. Measurement results of cladding area
Fig. 7. Schematic of overlap
Fig. 8. Single-layer multi-pass cladding path
Fig. 9. Single-layer multi-pass cladding topography.(a) Overlap rate of 30%; (b) overlap rate of 40%; (c) overlap rate of 50%
Fig. 10. Micro-section of multi-layer cladding. (a) Overlap ratio of 30%; (b) overlap ratio of 40%; (c) overlap ratio of 50%
| No. | Laser power /W | Scanning speed /(mm·s-1) | Powder feeding rate /(g·min-1) | Defocusing amount /mm |
|---|
| 1 | 1800 | 5 | 15 | -5 | | 2 | 1800 | 10 | 20 | 0 | | 3 | 1800 | 15 | 25 | +5 | | 4 | 2100 | 5 | 25 | 0 | | 5 | 2100 | 10 | 15 | +5 | | 6 | 2100 | 15 | 20 | -5 | | 7 | 2400 | 5 | 20 | +5 | | 8 | 2400 | 10 | 25 | -5 | | 9 | 2400 | 15 | 15 | 0 |
|
Table 1. Orthogonal test scheme
| Item | Excellent100‒90 | Very good<90‒80 | Good<80‒70 | Accepted<70‒60 | Failed<60 |
|---|
| Surface topography | The cladding layer is completely combined with the matrix, the surface of the cladding layer is smooth and the slag is very little | The cladding layer is completely combined with the matrix, the surface of cladding layer is smooth, and the slag is little | The cladding layer is completely combined with the substrate,the surface of cladding layer is rough, and the slag is relatively large | There is a small amounts of non-fusion between the cladding layer and the matrix, the surface of cladding layer is rough, and the slag is large | There is a lot of unfused defects between the cladding layer and the matrix, the surface of cladding layer is rough and the slag is very large | | Defect | No cracks, no pores | No cracks, few pores | No cracks, few pores | Small cracks, lots of pores | Large cracks, lots of pores | | Dilution rate | 6%‒13% | 14%‒20% | 21%‒29% | 30%‒37% | 38%‒48% |
|
Table 2. Judgment criteria of macro surface quality
| No. | Surface topography score | Defect score | Dilution rate /% |
|---|
| 1 | 75 | 70 | 16.1 | | 2 | 80 | 80 | 0 | | 3 | 60 | 65 | 4.1 | | 4 | 80 | 75 | 0 | | 5 | 75 | 70 | 46.4 | | 6 | 65 | 60 | 18.3 | | 7 | 80 | 85 | 22.8 | | 8 | 85 | 70 | 24.0 | | 9 | 75 | 75 | 21.4 |
|
Table 3. Surface morphology and defect scores and dilution rate of the cladding layer
| Project | Laser power(A) | Scanning speed(B) | Powder feeding rate (C) | Defocusing amount(D) |
|---|
| Macroscopic feature | 8.3 | 13.3 | 0 | 6.6 | | Order of influence:RB>RA>RD>RC | | Superior level combination: A3 B2 C D2 | | Imperfection | 8.3 | 10 | 5 | 10 | | Order of influence:RB=RD>RA>RC | | Superior level combination:A3 B1 C2 D2 | | Dilution rate | 16 | 10.5 | 18.6 | 17.3 | | Order of influence:RC>RD>RA>RB | | Superior level combination:A1 B1 C3 D2 |
|
Table 4. Range analysis
| No. | Matrix |
|---|
| 1 | B1=[0.07,0.20,0.50,0.20,0.03] | | 2 | B2=[0.10,0.20,0.43,0.17,0.10] | | 3 | B3=[0,0,0.10,0.43,0.47] | | 4 | B4=[0.10,0.10,0.37,0.27,0.17] | | 5 | B5=[0,0.07,0.23,0.37,0.33] | | 6 | B6=[0,0.07,0.13,0.53,0.27] | | 7 | B7=[0.23,0.33,0.40,0.03,0] | | 8 | B8=[0.07,0.10,0.27,0.23,0.33] | | 9 | B9=[0.17,0.23,0.40,0.17,0.03] |
|
Table 5. Fuzzy matrix evaluation results