
Jinpeng Zhang, Xunpeng Qin, Jiuxin Yuan, Xiaokai Wang, Yan Zeng. Defect Location and Size Detection Based on Laser Ultrasonic Diffraction Bulk Wave[J]. Acta Optica Sinica, 2020, 40(12): 1214002
- Acta Optica Sinica
- Vol. 40, Issue 12, 1214002 (2020)
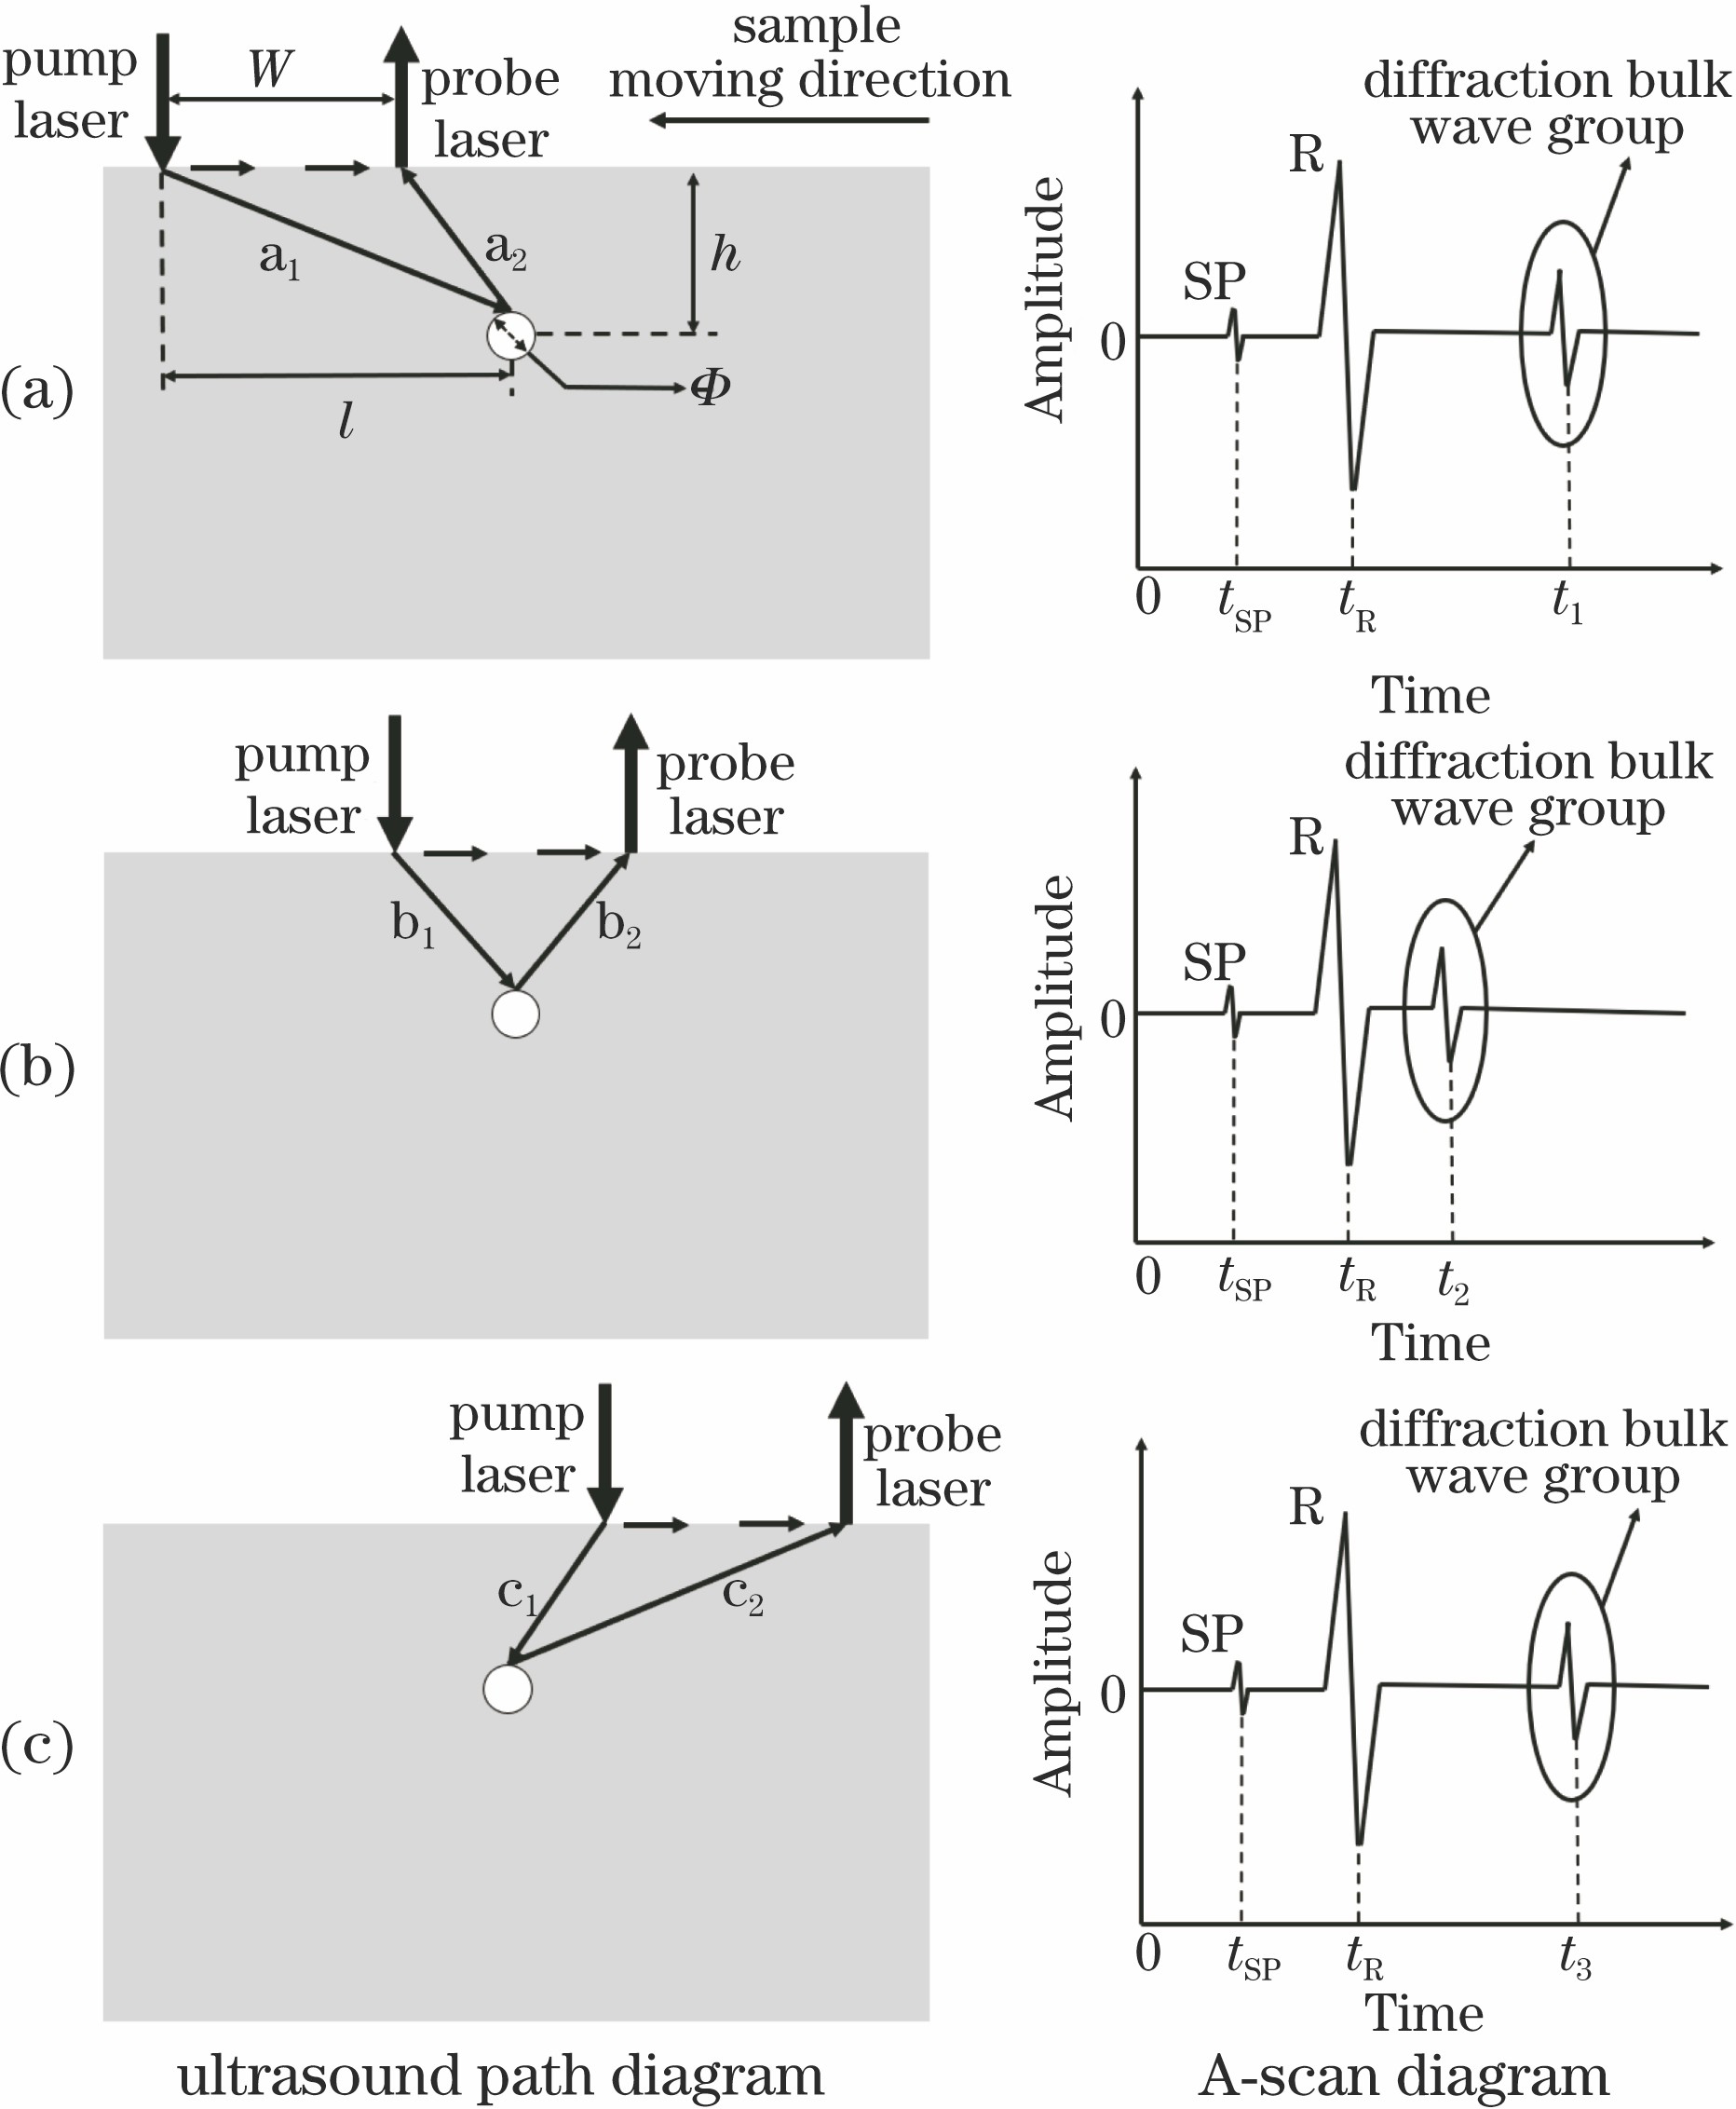
Fig. 1. Schematic of defect location detection. (a) Starting point; (b) middle point; (c) terminal point
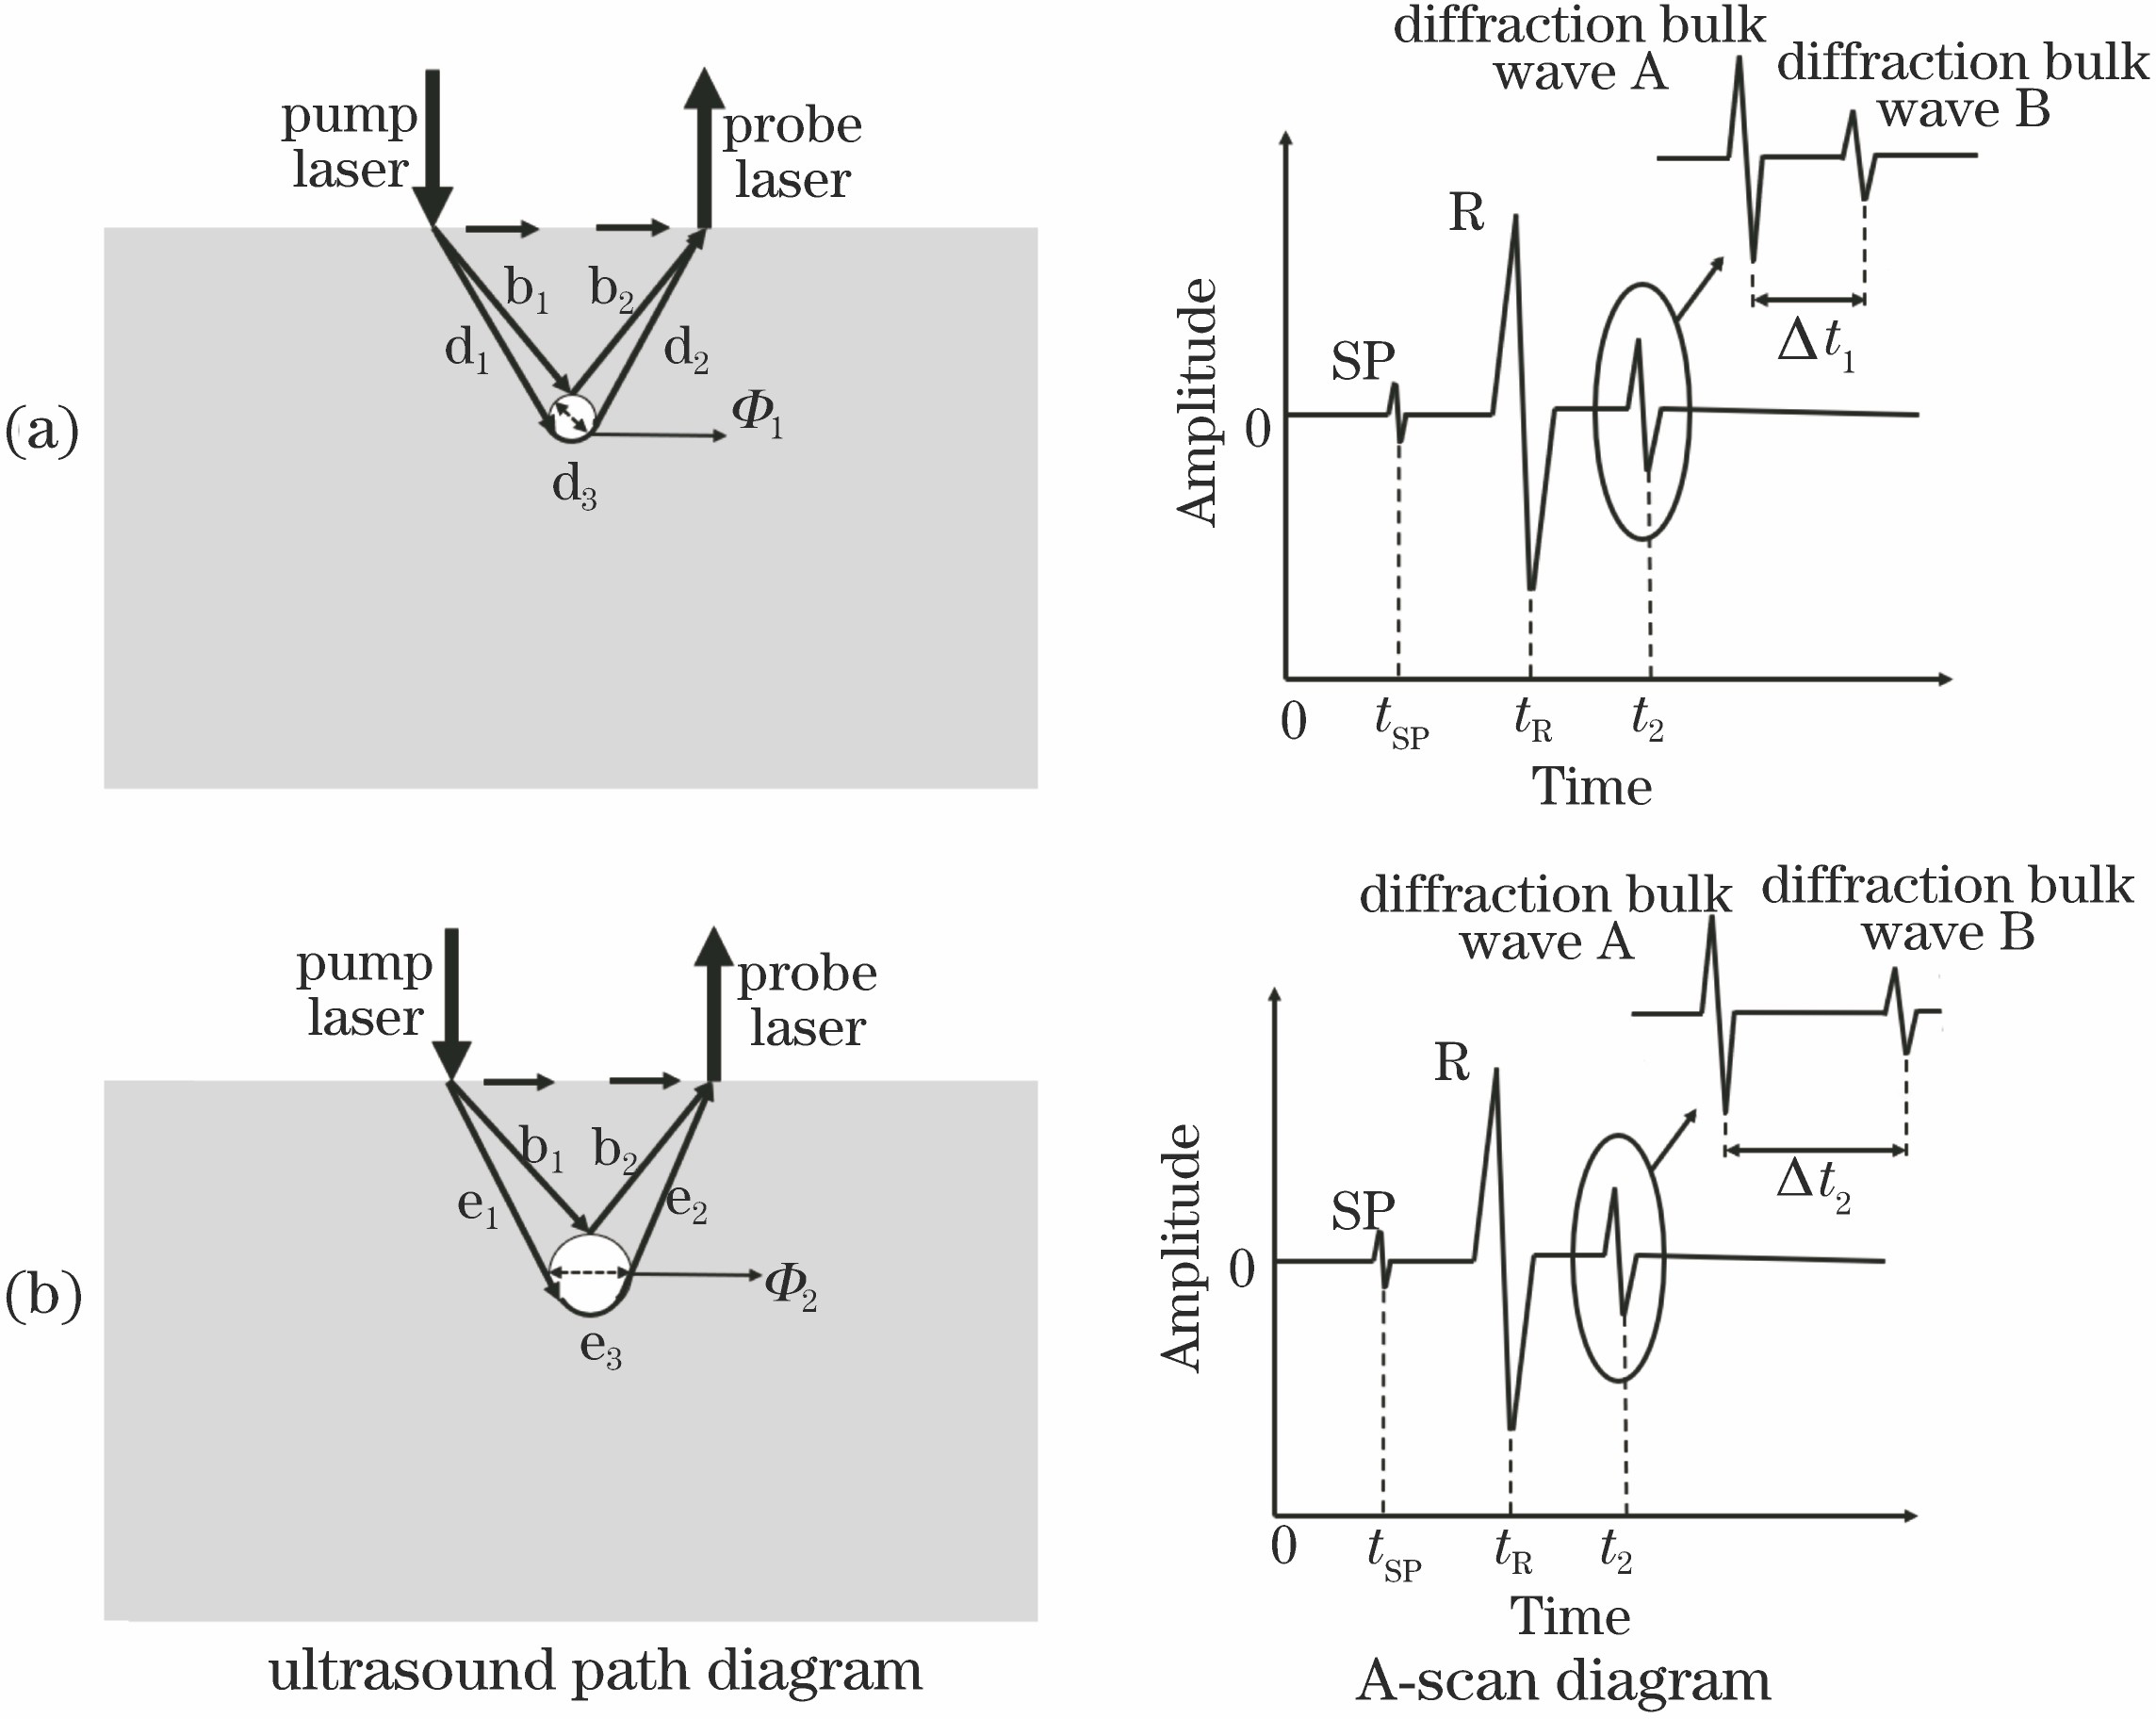
Fig. 2. Schematic of defect size detection. (a) Detection of defect with diameter Φ1; (b) detection of defect with diameter Φ2
Fig. 3. Schematic of Comsol finite element simulation model
Fig. 4. Interaction process between laser ultrasonic and internal defect. (a) t=2.05 μs; (b) t=2.50 μs; (c) t=3.60 μs; (d) t=4.15 μs; (e) t=4.50 μs; (f) t=5.00 μs
Fig. 5. Schematic of each-mode ultrasonic wave propagation
Fig. 6. Scanning schematic and calculation results when pump laser fixed and probe laser movable. (a) Schematic of scanning form; (b) calculation results of received signals
Fig. 7. Finite element simulation results when pump laser fixed and probe laser movable. (a) B-scan result with defects; (b) B-scan result without defects; (c) difference between B-scan results with and without defects
Fig. 8. Scanning schematic and calculation results of received signals when pump laser and probe laser simultaneously movable. (a) Schematic of scanning form; (b) block 1; (c) block 2; (d) block 3
Fig. 9. Laser ultrasonic detection system. (a) Schematic of system; (b) experimental image of system
Fig. 10. Experiment on shear wave velocity measurement. (a) Experimental diagram; (b) experimental result
Fig. 11. Diagram of 45 steel block to be detected. (a) Three-dimensional diagram; (b) physical diagram
Fig. 12. Scanning schematic of defects detected by laser ultrasonic diffraction bulk wave method
Fig. 13. Experimental results of B-scan for each defect. (a) defect 1; (b) defect 2; (c) defect 3
Fig. 14. Schematic of calculation of defect location and size
Fig. 15. Relative errors from defect diffraction bulk wave detection method
|
Table 1. Sound speed of each-mode ultrasonic wave in 45 steel
|
Table 2. Parameters of internal defects in 45 steel block
|
Table 3. Arrival time of SS wave and SCS wave at different scanning distances
|
Table 4. Experimental results from defect diffraction bulk wave detection method

Set citation alerts for the article
Please enter your email address
© Copyright 2018-2021 | Chinese Laser Press. All Rights Reserved 沪ICP备15018463号-20