
Qiu-lan ZHANG, Zhi ZHU, Zi-jian WEN, Yong-nian NI. Interaction Between Graphene Quantum Dots and Trypsin With Spectroscopic and Chemometrics Approaches[J]. Spectroscopy and Spectral Analysis, 2020, 40(10): 3141
- Spectroscopy and Spectral Analysis
- Vol. 40, Issue 10, 3141 (2020)
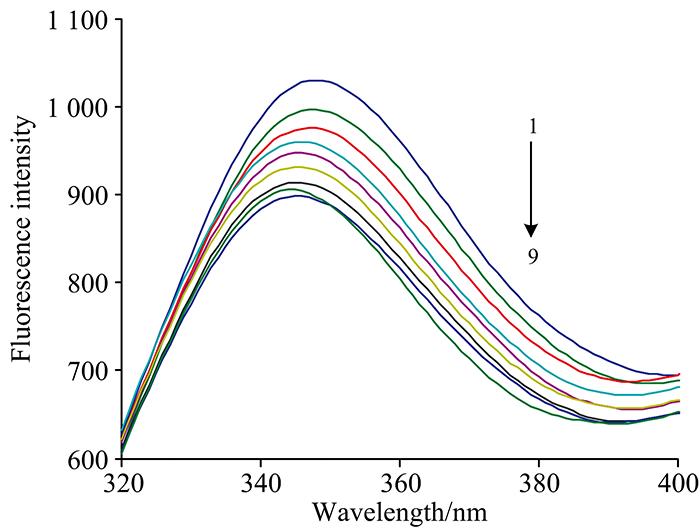
Fig. 1. The fluorescence spectra of the interaction of GQDs with trypsin
![The CD spectra of the interaction of GQDs with trypsincTryp=3.33×10⁻⁶ mol·L-1, [GQDs]:[Tryp]=0, 5, 10, 15, 20](/richHtml/gpxygpfx/2020/40/10/3141/img_2.png)
Fig. 2. The CD spectra of the interaction of GQDs with trypsin
c Tryp=3.33×10⁻⁶ mol·L-1, [GQDs]:[Tryp]=0, 5, 10, 15, 20
Fig. 3. Three dimensional fluorescence spectra of the interaction of GQDs with trypsin
(a):c Tryp=4.17×10⁻⁶ mol·L-1; (b): c Tryp=4.17×10⁻⁶ mol·L-1; c GQDs=4.17×10⁻⁵ mol·L-1
(a):
Fig. 4. The activity of Trypsin in the presence of GQDs
c Tryp=4.17×10⁻⁶ mol·L-1, GQDs was added to this solution in the range of 0~8.33×10⁻⁵ mol·L-1 with an interval of 8.33×10⁻⁶ mol·L-1, the concentration of BAEE was 1.67×10⁻⁴ mol·L-1
Fig. 5. The UV-Vis spectra of the interaction of GQDs with trypsin
(a): (1→21): The concetration of Tryp was kept at 1.67×10⁻⁵ mol·L-1; GQDs was added to this solution in the range of 0~3.33×10⁻⁴ mol·L-1 with an interval of 1.67×10⁻⁵ mol·L-1; (b): (1→21): The concetration of GQDs was kept at 1.67×10⁻⁵ mol·L-1, Tryp was added to this solution in the range of 0~2.22×10⁻⁶ mol·L-1 with an interval of 1.11×10⁻⁷mol·L-1
(a): (1→21): The concetration of Tryp was kept at 1.67×10⁻⁵ mol·L-1; GQDs was added to this solution in the range of 0~3.33×10⁻⁴ mol·L-1 with an interval of 1.67×10⁻⁵ mol·L-1; (b): (1→21): The concetration of GQDs was kept at 1.67×10⁻⁵ mol·L-1, Tryp was added to this solution in the range of 0~2.22×10⁻⁶ mol·L-1 with an interval of 1.11×10⁻⁷mol·L-1
Fig. 6. Recovered UV-Vis spectra (a) and concentration profiles (b) and (c)
|
Table 1. The experimental conditions to build up the extension matrixes

Set citation alerts for the article
Please enter your email address
© Copyright 2018-2021 | Chinese Laser Press. All Rights Reserved 沪ICP备15018463号-20