• Journal of Infrared and Millimeter Waves
  • Vol. 40, Issue 3, 363 (2021)
Qi-Xing TANG1、2、*, Yu-Jun ZHANG1、**, Ying HE1, Li-Ming WANG1, Meng-Qi LI1, Kun YOU1, Xiao-Yi LI1, Dong CHEN3, and Wen-Qing LIU1
Author Affiliations
  • 1Key Laboratory of Environmental Optics& Technology, Anhui Institute of Optics and Fine Mechanics, the Chinese Academy of Sciences, Hefei, 230031, China
  • 2Anhui Agricultural University, Hefei, 230061, China
  • 3Hefei University of Technology, Hefei 230009, China
  • show less
    DOI: 10.11972/j.issn.1001-9014.2021.03.013 Cite this Article
    Qi-Xing TANG, Yu-Jun ZHANG, Ying HE, Li-Ming WANG, Meng-Qi LI, Kun YOU, Xiao-Yi LI, Dong CHEN, Wen-Qing LIU. Improving measurement accuracy of composite non-point sources emissions based on laser detection[J]. Journal of Infrared and Millimeter Waves, 2021, 40(3): 363 Copy Citation Text show less

    Abstract

    In the measurement of source emissions, it is inevitably interfered by the gas emissions from the adjacent fields and turbulence, which affects the accuracy of gas detection. In order to improve the measurement accuracy, the measurement method of composite non-point sources non-uniformity methane emissions based on laser spectrum detection has been studied. Moreover, the interference in external environment is reduced with multiple self-calibration measurements. A detection system for composite non-point source emissions has been established, and the detection method of eliminating gas fluctuation has been proposed. First, the accuracy verification test has been carried out. The standard deviation of source a is 0.17, and that of source b is 0.18. Subsequently, a comparative test has been carried out with the extraction method of the photo acoustic spectrum, and the correlation coefficient reached 0.91. Finally, the actual field measurement has been carried out to monitor the two non-uniform emission sources caused by different fertilization methods to achieve accurate measurement. It has practical engineering value such as agricultural gas emission and environmental gas detection.

    Introduction

    Analysis of global warming potential(GWP) shows that methane is an important greenhouse gas with a global warming potential per molecule 28 times greater than that of carbon dioxide1-2. The concentration of methane in the atmosphere is greatly affected by human activities3-6. Therefore, long-term monitoring of methane emission is of great significance for accurate assessment of emission levels. The existing methods for measuring non-point source emission are mainly divided into micro-meteorological method7-8 based optical remote sensing and box method9. The micro-meteorological detection methodbased optical remote sensing is a measurement under natural growth state. The tunable diode laser spectroscopy(TDLAS) has the advantages of high sensitivity, real time, fast analysis10-12, making it an ideal micro-meteorological detection method of gas emission measurement.

    In recent years, Thomas K. Flesch has conducted extensive research on the micro-meteorological method based optical remote sensing13-14 and has gradually applied it to the measurement of gas emissions in farmland, pasture, and bio-digester. Yang Wenliang et al.15 used it to study on the monitoring of ammonia emission from farmland. Most of the above studies carried out for measurement analysis. The measurement method of composite non-point sources non-uniformity methane emissions based on laser spectrum detection is studied. A detection system for composite non-point sources emissions is designed. And detection method of eliminating gas fluctuation is proposed. A series of experiments are carried out to verify its accuracy, which has important practical significance for multi-source measurements.

    1 Measurement principle

    According to Beer-Lambert's law:

    I=I0exp-S*ΦPcL

    where I0 denotes the incident light intensity, I denotes the transmitted light intensity, S*cm-2atm-1is the absorption line intensity, Φ(cm) is the normalized linear function, Patm) is the total gas pressure, c%)is the component concentration of the absorbed gas, Lcm) is the actual optical absorbing path length. and so:

    c=1S*ΦPLln I0I=AS*PL

    where A is the integral absorbance.

    The concentration can be inverted by the standard absorption signal and the measured signal obtained by the experimental system, then the measured concentration is expressed as:

    c=AA0L0Lc0

    where c0 is the concentration of the standard gas in the sample cell, L0cm) is the optical path length of the standard gas in the sample cell, A0 is the integral absorbance of the standard gas in the sample cell, Lcm)is the actual optical path length of the experimental system, and A is the fitted integral absorbance.

    When TDLAS is used for long-path open monitoring, the transmitted beam is inevitably affected by turbulence, which causes the intensity fluctuation, the phase fluctuation, the beam expansion, and other phenomena, finally affecting the accuracy of absorption spectrum detection. Then the gas concentration can be expressed as:

    ct=c+δt

    where δt) is the fluctuation.

    By using the Eq.(5), the emission rate Q can be inferred from the concentration at M andc/QSIM, and cb is the background gas concentration.

    Q=c-cbc/QSIM .

    The(c/QSIM is calculated by summing the reciprocal of the w0 where the grounding occurs within the source boundary, it can be expressed as Eq.(6).

    c/QSIM=1n2w0

    where the variable n is the total number of calculated particles released from M, and the sum only covers the touchdown within the source region, w0 is the vertical velocity at ground contact. Generally, 50000 particles are released by default.

    2 Detection system for composite non-point sources emissions

    The system block diagram is shown in Fig. 1.

    System layout

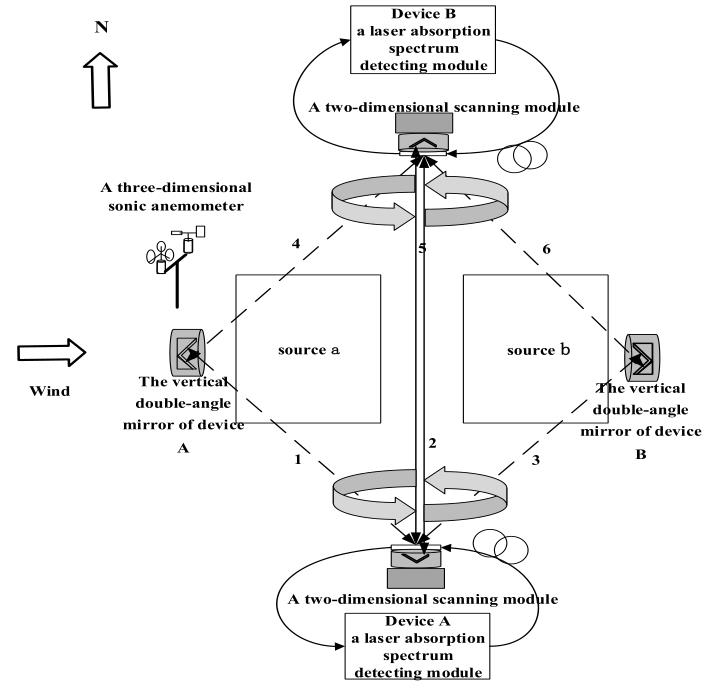
    Figure 1.System layout

    The detection system for composite non-point sources is applied to the area to be tested which is composed of the source a and source b to be tested. The system mainly consists of two concentration gas detecting devices(device A and device B) and a three-dimensional sonic anemometer. The device A is integrated with a laser absorption spectrum detecting module, a transceiver telescope, a two-dimensional scanning module, and three corner reflectors. The detection light source uses a DFB laser with the center wavelength at 1 653 nm which is the near-infrared single absorption line of CH4. The transceiver telescope and a corner mirror constitute an optical integrated unit of the device A, which is installed on the two-dimensional scanning module. The other two corner mirrors are placed vertically to form a vertical double-angle mirror of device A. Device B is set in the same way.

    Device A and device B perform a two-dimensional six path self-calibration scan on source a and source b gases. The laser A generated by the laser absorption spectrum detecting module in the device A is sent to its own transmitting and receiving telescope, which is an optical integrated unit. Three optical paths are scanned by the laser A in one measurement period to form the first optical path, the second optical path, and the third optical path to obtain the concentrations c1t), c2t), and c3t).

    Similarly, the fourth optical path, the fifth optical path, and the sixth optical path are scanned by the laser B in the same measurement cycle to obtain the concentrations c4t)、c5t), and c6t). The second light road and the fifth light road are the common optical path. The background concentration is calculated by c1t) and c4t) based on the unequal precision weights of the two devices. The difference in the gas concentration of the corresponding optical path is obtained by subtracting the background concentration from c2t), c3t), c5t), and c6t).

    The WindTrax software is used. Combined with the positional relationship of the detection system, the contribution coefficients of device A and device B are obtained respectively. The gas emission by device A and device B are fused according to different contributions to obtain the Qa of the source a and the Qb of the source b.

    3 Detection method and verification of eliminating gas fluctuation

    The flow chart of the detection method for eliminating gas fluctuation is shown in Fig. 2. Firstly, the signals from the unabsorbed spectral region in the same period are subjected to two-step fitting. Then, according to the unequal precision, the background signal is obtained and eliminated. Due to external interference, there is still a lot of noise in the signal after removing the background. It needs de-noising, adaptive iterative fitting, and inversion of methane concentration.

    The flow chart of the detection method for eliminating gas fluctuation

    Figure 2.The flow chart of the detection method for eliminating gas fluctuation

    Since the second light road and the fifth light road shared the optical path, the two devices can be self-calibrated to correct the concentration. In order to ensure the accuracy of self-calibration, a sample cell with a known concentration is placed in the detection optical path and used it to calibrate the concentration obtained by the two devices at the same time.

    It’s shown in Fig. 3 that the proposed method can obtain a more effective background signal in the fitting. Based on the reference spectral data at the same time, the maximum fluctuation of the traditional method is 19.42%, while that of this method is 3.17%(Fig. 4). For the elimination of background noise, the signal-to-noise ratio by the proposed method is significantly better than the traditional fitting method. At the same time, it can also be seen that there is still a lot of noise in the signal after removing the background due to the external disturbance.

    Fitting for the signal

    Figure 3.Fitting for the signal

    The background noise elimination

    Figure 4.The background noise elimination

    The standard absorption curve is reconstructed by adaptive iterative fitting to suppress noise. When performing adaptive iterative fitting, it is achieved by setting the optimal criterion to find the residual difference between the fitting result and the original function. The black curve(Fig. 5) is obtained by de-noising the modified spectral signal, and the fluctuation is obviously reduced. The red curve is obtained by adaptive iterative fitting, and the correlation coefficient reaches 0.977, which verifies its effectiveness.

    Adaptive iterative fitting signal

    Figure 5.Adaptive iterative fitting signal

    4 Experimental verification

    4.1 Verification experiment of the measurement method

    The detection system is shown in Fig. 6. The effective length of the first and the fourth optical path is 56 m, the second and fifth optical path are both 58m, the third and sixth optical path are both 56 m. The height of the detection optical path is set to 70 cm.

    Experimental site map

    Figure 6.Experimental site map

    Emissions from different sources are simulated by using two sets of gas simulation volatilization devices.

    Experiments are carried out according to different sources to be tested. Calculate the ratio of the emission to the actual release rate Q(using Eq.(7).) and compare it with 1. The measurement results of the source a is shown in Fig. 7, and the measurement result of the source b is shown in Fig. 8.

    Q=mS×T

    where S is the area of artificial simulation source, T is time, and m is the amount of methane released.

    Accuracy measurement experimental results of source a

    Figure 7.Accuracy measurement experimental results of source a

    Accuracy measurement experimental results of source b

    Figure 8.Accuracy measurement experimental results of source b

    It can be seen from the measurement results that the standard deviation of Qca/Qa for source a is 0.17, and the standard deviation of Qcb/Qb for source b is 0.18, which proves its validity.

    4.2 Comparative experiment

    In the comparative experiment, two systems are used to measure the same sources. One of the systems is the designed detection system for composite non-point sources, the other system is the photo acoustic spectroscopy system by extraction mode. System one: Simultaneous measurement of two sources during measurements. System two: First measure the source a, and measure the source b after one-time measurement is completed.

    The effective length of the first and fourth optical path is 48 m, the second and fifth optical path are both 50 m, the third and sixth optical path are both 46 m. The height of the detection optical path is set to 73 cm.

    Correlation analysis is performed by comparing the Q obtained by different measurement techniques with the actual release rate Q, as shown in the following figures. It can be seen from the measurement results that the correlation of the two measurement techniques(Fig. 910) is good. However, the box method changes the natural environment, and the spatial representation is poor, resulting in a large measurement error. Compared with the static box method, the proposed method is more flexible, simple, and timely.

    Experimental results of source a consistency

    Figure 9.Experimental results of source a consistency

    Experimental results of source b consistency

    Figure 10.Experimental results of source b consistency

    4.3 Methane monitoring experiment in Fengqiu Ecological Station

    The agricultural wheat methane emissions are measured from April 24 to May 4, and the monitoring time lasted for 12 days. The concentration of methane is measured by device A and the device B based on the open-path optical method. Phosphorus fertilizer was applied to source a and biochar was applied to source B respectively, and irrigation was conducted in the same way.

    The experimental measurement site is shown in Fig. 11. The effective length of the first and fourth optical path is 98 m, the second and fifth optical path are both 100 m, the third and sixth optical path are both 98 m. The height of the detection optical path is set to 1.4 m.

    (a) Experimental site situation, (b)Telescope Experimental site situation

    Figure 11.(a) Experimental site situation, (b)Telescope Experimental site situation

    (1)Continuous observation and analysis of concentration

    The methane concentration c-cb result is shown in Fig. 12. The measurement was interrupted by Heavy rain on the night of the 24 th. Due to the influence of heavy rainfall, the methane emissions from 25 th to 27 th gradually increased and stabilized. After the 29 th, the methane emission of the source a and the source b shows a diurnal variation. The maximum value of the daily average concentration difference for the source a is 1.75 ppm, and the source b is 1.62 ppm.

    The methane concentration c-cb result

    Figure 12.The methane concentration c-cb result

    (2)Analysis of Q measurement results

    It can be seen from Fig. 13 that due to the influence of heavy rainfall, the methane emission of the source a and the source b has a significant downward trend, and then tend to rise. The average of the source a is 31.14 ug/m2/s, and the source b is 43.72 ug/m2/s. It can be seen from the results that the method can accurately measure the emission of the composite sources.

    Q measurement result

    Figure 13.Q measurement result

    5 Conclusions

    In the measurement of source emissions, it is inevitably interfered by the gas emissions from the adjacent fields and turbulence, which affects the accuracy of gas detection. Aiming at the problem, the measurement method of composite non-point sources non-uniformity methane emissions based on laser spectrum detection has been studied. The detection system for composite non-point sources has been designed. And detection method of eliminating gas fluctuation has been proposed. A series of experiments has been carried out.

    1 The accuracy verification test has been carried out. The standard deviation of source a is 0.17, and that of source b is 0.18.

    2. Compared with the extraction method of the photo acoustic spectrum, the proposed method is more flexible, simple, and timely.

    3. The actual field measurement has been carried out to monitor the two non-uniform emission sources caused by different fertilization methods to achieve accurate measurement.

    References

    [1] B L MILLER, E V ARNTZEN, A E GOLDMAN et al. Methane Ebullition in Temperate Hydropower Reservoirs and Implications for US Policy on Greenhouse Gas Emissions. Environmental Management, 60, 615-629(2017).

    [2] C KNOBLAUCH, C BEER, S LIEBNER et al. Methane production as key to the greenhouse gas budget of thawing permafrost. Nature Climate Change, 8, 309-312(2018).

    [3] S M MOUSAVI, S FALAHATKAR. Spatiotemporal Distribution Patterns of Atmospheric Methane Using GOSAT Data in Iran. Environment Development and Sustainability, D23(2019).

    [4] Q CHEN, B GUO, C ZHAO, B XING. Characteristics of CH4 and CO2 emissions and influence of water and salinity in the Yellow River delta wetland. China Environmental Pollution, 239, 289-299(2018).

    [5] K W ALEXANDER, H SHARI, F MAX et al. Quantifying the impacts of human activities on reported greenhouse gas emissions and removals in Canada’s managed forest: conceptual framework and implementation. Canadian Journal of Forest Research, 48, 1227-1240(2018).

    [6] J HU et al. Greenhouse Gas Emissions Under Different Drainage and Flooding Regimes of Cultivated Peatlands. Journal of Geophysical Research: Biogeosciences, 122, 3047-3062(2017).

    [7] R A HASHMONAY, R M VARMA, M T MODRAK et al. Radial Plume Mapping: A US EPA Test Method for Area and Fugitive Source Emission Monitoring Using Optical Remote Sensing. Advanced Environmental Monitoring(2008).

    [8] C D GOLDSMITH, J CHANTON, T ABICHOU et al. Methane emissions from 20 landfills across the United States using vertical radial plume mapping. Journal of the Air & Waste Management Association, 62, 183-197(2012).

    [9] K M BRUNING, J A KOZIEL, D L MAURER et al. Greenhouse Gas Emissions from Land-Applied Swine Manure: Development of Method Based On Static Flux Chambers. Agricultural and Biosystems Engineering Presentations, Posters and Proceedings(2013).

    [10] P WERLE, R. MÜCKE, F SLEMR. The limits of signal averaging in atmospheric trace-gas monitoring by tunable diode-laser absorption spectroscopy (TDLAS). Applied Physics B, 57, 131-139(1993).

    [11] O WITZEL, A KLEIN, C MEFFERT et al. VCSEL-based, high-speed, in situ TDLAS for in-cylinder water vapor measurements in IC engines. Optics Express, 21, 19951-19965(2013).

    [12] C LIU, L XU, J CHEN et al. Development of a fan-beam TDLAS-based tomographic sensor for rapid imaging of temperature and gas concentration. Optics Express, 23, 22494-511(2015).

    [13] T K FLESCH et al. Micrometeorological Measurements Reveal Large Nitrous Oxide Losses during Spring Thaw in Alberta. Atmosphere, 12(2018a).

    [14] T K FLESCH, J A BASARAB, V S BARON et al. Methane emissions from cattle grazing under diverse conditions: An examination of field configurations appropriate for line-averaging sensors. Agricultural & Forest Meteorology, S0168192317303325(2017).

    [15] W L YANG, A N ZHU, J B ZHANG et al. Assessing the backward Lagrangian stochastic model for determining ammonia emissions using a synthetic source. Agricultural and Forest Meteorology, 216, 13-19(2016).

    Qi-Xing TANG, Yu-Jun ZHANG, Ying HE, Li-Ming WANG, Meng-Qi LI, Kun YOU, Xiao-Yi LI, Dong CHEN, Wen-Qing LIU. Improving measurement accuracy of composite non-point sources emissions based on laser detection[J]. Journal of Infrared and Millimeter Waves, 2021, 40(3): 363
    Download Citation