• Laser & Optoelectronics Progress
  • Vol. 58, Issue 22, 2230001 (2021)
Shiyu Deng1、2, Chengzhi Liu1、4、*, Yong Tan3、**, Delong Liu1, Chunxu Jiang3, Zhe Kang1, Zhenwei Li1, Cunbo Fun1、4, Chengwei Zhu1, Nan Zhang1, Long Chen1、2, Bingli Niu1、2, and Zhong Lü3
Author Affiliations
  • 1Changchun Observatory, National Astronomical Observators, Chinese Academy of Sciences, Changchun, Jilin 130117, China
  • 2University of Chinese Academy of Sciences, Beijing 100049, China
  • 3School of Science, Changchun University of Science and Technology, Changchun, Jilin 130022, China
  • 4Key Laboratory of Space Object & Debris Observation, Chinese Academy of Sciences, Nanjing, Jiangsu 210008, China;
  • show less
    DOI: 10.3788/LOP202158.2230001 Cite this Article Set citation alerts
    Shiyu Deng, Chengzhi Liu, Yong Tan, Delong Liu, Chunxu Jiang, Zhe Kang, Zhenwei Li, Cunbo Fun, Chengwei Zhu, Nan Zhang, Long Chen, Bingli Niu, Zhong Lü. Application of Multiple Spectral Observation Methods of Space Targets[J]. Laser & Optoelectronics Progress, 2021, 58(22): 2230001 Copy Citation Text show less
    Overall schematic of optical telescope
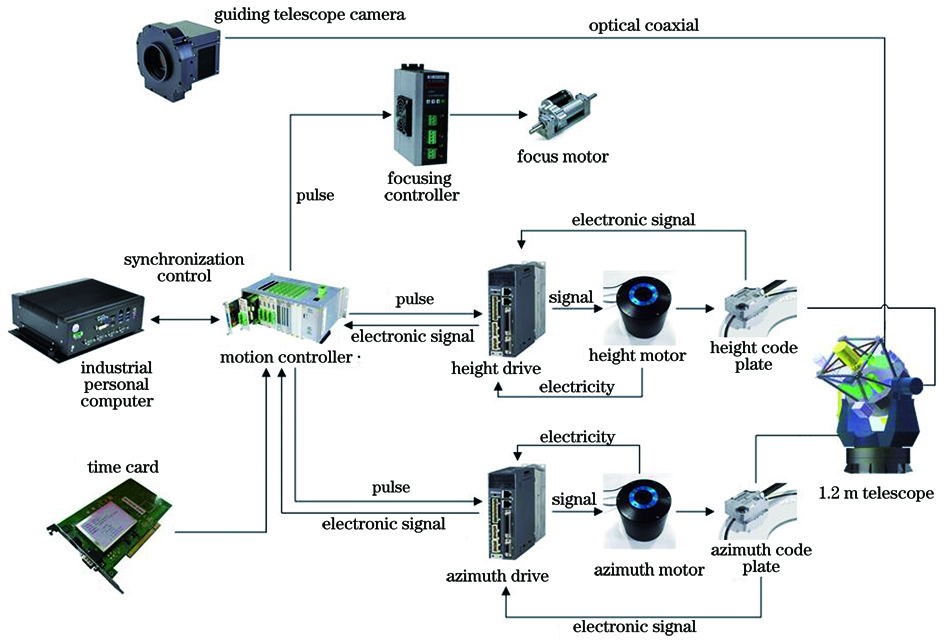
    Fig. 1. Overall schematic of optical telescope
    Limitation test of 1.2 m large-aperture optical telescope. (a) Pointing path of telescope with curve indicating trajectory and straight line indicating pointing target of telescope; (b) tracking results of telescope
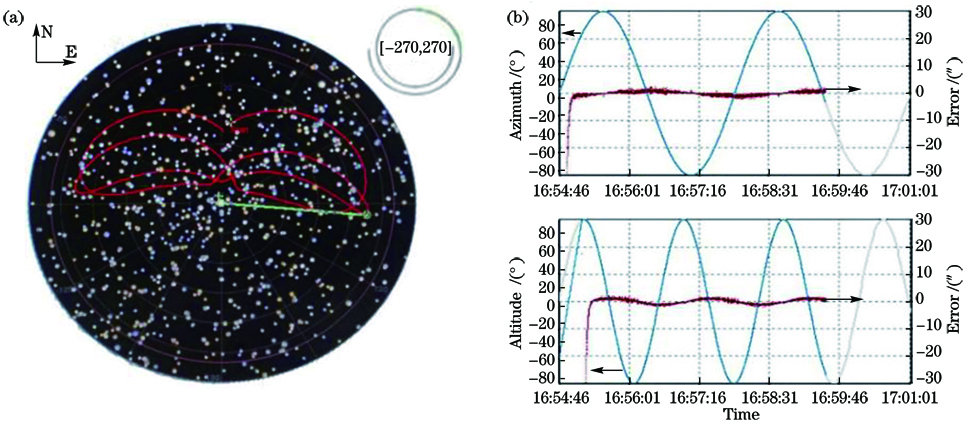
    Fig. 2. Limitation test of 1.2 m large-aperture optical telescope. (a) Pointing path of telescope with curve indicating trajectory and straight line indicating pointing target of telescope; (b) tracking results of telescope
    Optical schematic of grating spectrometer
    Fig. 3. Optical schematic of grating spectrometer
    Diagram of telescope with single-slit grating spectrometer. (a) Schematic of equipment assembly; (b) single-slit grating spectrometer mounted on optical telescope focus system
    Fig. 4. Diagram of telescope with single-slit grating spectrometer. (a) Schematic of equipment assembly; (b) single-slit grating spectrometer mounted on optical telescope focus system
    Polaris spectra obtained by method one. (a) First observation; (c) second observation
    Fig. 5. Polaris spectra obtained by method one. (a) First observation; (c) second observation
    Spectrum of 5.80 magnitude star
    Fig. 6. Spectrum of 5.80 magnitude star
    Optical schematic of fiber spectrometer
    Fig. 7. Optical schematic of fiber spectrometer
    Diagram of telescope with optical fiber spectrometer. (a) Schematic of equipment assembly; (b) terminal box with optical fiber through collimator; (c) front side of spectrometer
    Fig. 8. Diagram of telescope with optical fiber spectrometer. (a) Schematic of equipment assembly; (b) terminal box with optical fiber through collimator; (c) front side of spectrometer
    Polaris spectra obtained by method two. (a) First round; (b) second round
    Fig. 9. Polaris spectra obtained by method two. (a) First round; (b) second round
    Measured spectra of stars with different magnitudes. (a1)(a2) 5 magnitude; (b1)(b2) 6 magnitude; (c1)(c2) 7 magnitude; (d1)(d2) 8 magnitude
    Fig. 10. Measured spectra of stars with different magnitudes. (a1)(a2) 5 magnitude; (b1)(b2) 6 magnitude; (c1)(c2) 7 magnitude; (d1)(d2) 8 magnitude
    Optical schematic diagram of sCMOS camera imaging spectrometer with liquid crystal tunable filter
    Fig. 11. Optical schematic diagram of sCMOS camera imaging spectrometer with liquid crystal tunable filter
    Filter spectrometer camera. (a) Schematic of equipment assembly; (b) liquid crystal tunable filter; (c) sCMOS camera
    Fig. 12. Filter spectrometer camera. (a) Schematic of equipment assembly; (b) liquid crystal tunable filter; (c) sCMOS camera
    Polaris spectrum obtained by method three
    Fig. 13. Polaris spectrum obtained by method three
    Images of target at different wavelengths
    Fig. 14. Images of target at different wavelengths
    Brightness of target in Fig. 14 versus wavelength
    Fig. 15. Brightness of target in Fig. 14 versus wavelength
    Spectral data of GEO target. (a) First round; (b) second round
    Fig. 16. Spectral data of GEO target. (a) First round; (b) second round
    ParameterContent
    Aperture size≥ 1200 mm
    Prime focusFocal length >2000 mm, field ≥1.5°×1.5°, efficiency ≥70%
    Cassegrain focusFocal length <9195 mm, field ≥11'×11', efficiency ≥70%
    Tracking speedAzimuth velocity ≥6(°)/s, altitude speed ≥2(°)/s, acceleration ≥1(°)/s2
    Tracking accuracy0.2(″)/10 s for star, and ~5″ for space target
    Pointing accuracy≤ 5″
    Axis rotation rangePosition: ± 270°Altitude: 0--95°
    Table 1. Technical parameters of 1.2 m large-aperture spatial optical telescope
    ElementTypeManufacturerTechnical index
    Guiding scopeLX800 ACFMeadeOptical design: RC foldback system with aspheric correction mirror
    Aperture size: 12 inch
    Focal length: 2438 mm, f/8
    Resolution: 0.38″
    Primary /secondary mirror material: low elongation borosilicate glass
    Correction mirror material: broad-spectrum high-transparency borosilicate float glass
    Optical coating: ultra high temperature ceramics
    Part: f/5zoomTypical narrow field of view with zoom: 57.2'×45.8'
    CameraKL4040FLIPhotosensitive chip: sCMOS
    Photosensitive method: front illuminated
    Number of pixels: 4096×4096
    Pixel size: 9 μm×9 μm
    Chip size: 52.1 mm
    Full well electron: 7e-×104
    Maximum transmission frequency: 24 frame/s
    Maximum readout noise: 3.7e-
    Highest quantum efficiency: 74%
    Wind cooling temperature: at least 40 ℃
    Dark current: 0.15e- @-20 ℃
    Table 2. Configuration list of guiding system
    InstrumentManufacturerTechnical index
    LCTFCRiSpectral range: 400--720 nm
    Bandwidth(full width at half maximum): 10 nm
    Minimum jump spectral width: 1 nm
    Minimum jump time: 50 ms
    Operating temperature: 10--40 ℃
    Instrument size: 3.36 inch×1.95 inch×2.01 inch
    Field of view: 7.5° half-angle
    Maximum amount of light: 500 mW/cm2
    Caliber size: 35 mm
    CameraHAMAMATSUResolution: 2048×2048
    Pixel area: 6.5 μm×6.5 μm
    Peak quantum efficiency: 82% @560 nm
    Readout noise: 1.0 median
    Bit depth: 16 bit
    Maximum frame rate: 40 frame/s
    Ceramic thermostatHomemadeTemperature control range: -5--80 ℃
    Direct voltage: 24 V
    Power consumption: 120 W
    Table 3. Equipment parameters
    PerformanceProject 1Project 2Project 3
    Equipment costHighMediumMedium
    Optical path debugging degreeHighHighLow
    Obtained light intensityMediumLowHigh
    Adjustable observation bandLowHighHigh
    Degree of data processingMediumMediumHigh
    Table 4. Performance comparison of different methods
    Shiyu Deng, Chengzhi Liu, Yong Tan, Delong Liu, Chunxu Jiang, Zhe Kang, Zhenwei Li, Cunbo Fun, Chengwei Zhu, Nan Zhang, Long Chen, Bingli Niu, Zhong Lü. Application of Multiple Spectral Observation Methods of Space Targets[J]. Laser & Optoelectronics Progress, 2021, 58(22): 2230001
    Download Citation