
Duo Jin, Zhenxu Bai, Zhongan Zhao, Yifu Chen, Wenqiang Fan, Yulei Wang, Richard P. Mildren, Zhiwei Lü. Linewidth narrowing in free-space-running diamond Brillouin lasers[J]. High Power Laser Science and Engineering, 2023, 11(4): 04000e47
- High Power Laser Science and Engineering
- Vol. 11, Issue 4, 04000e47 (2023)
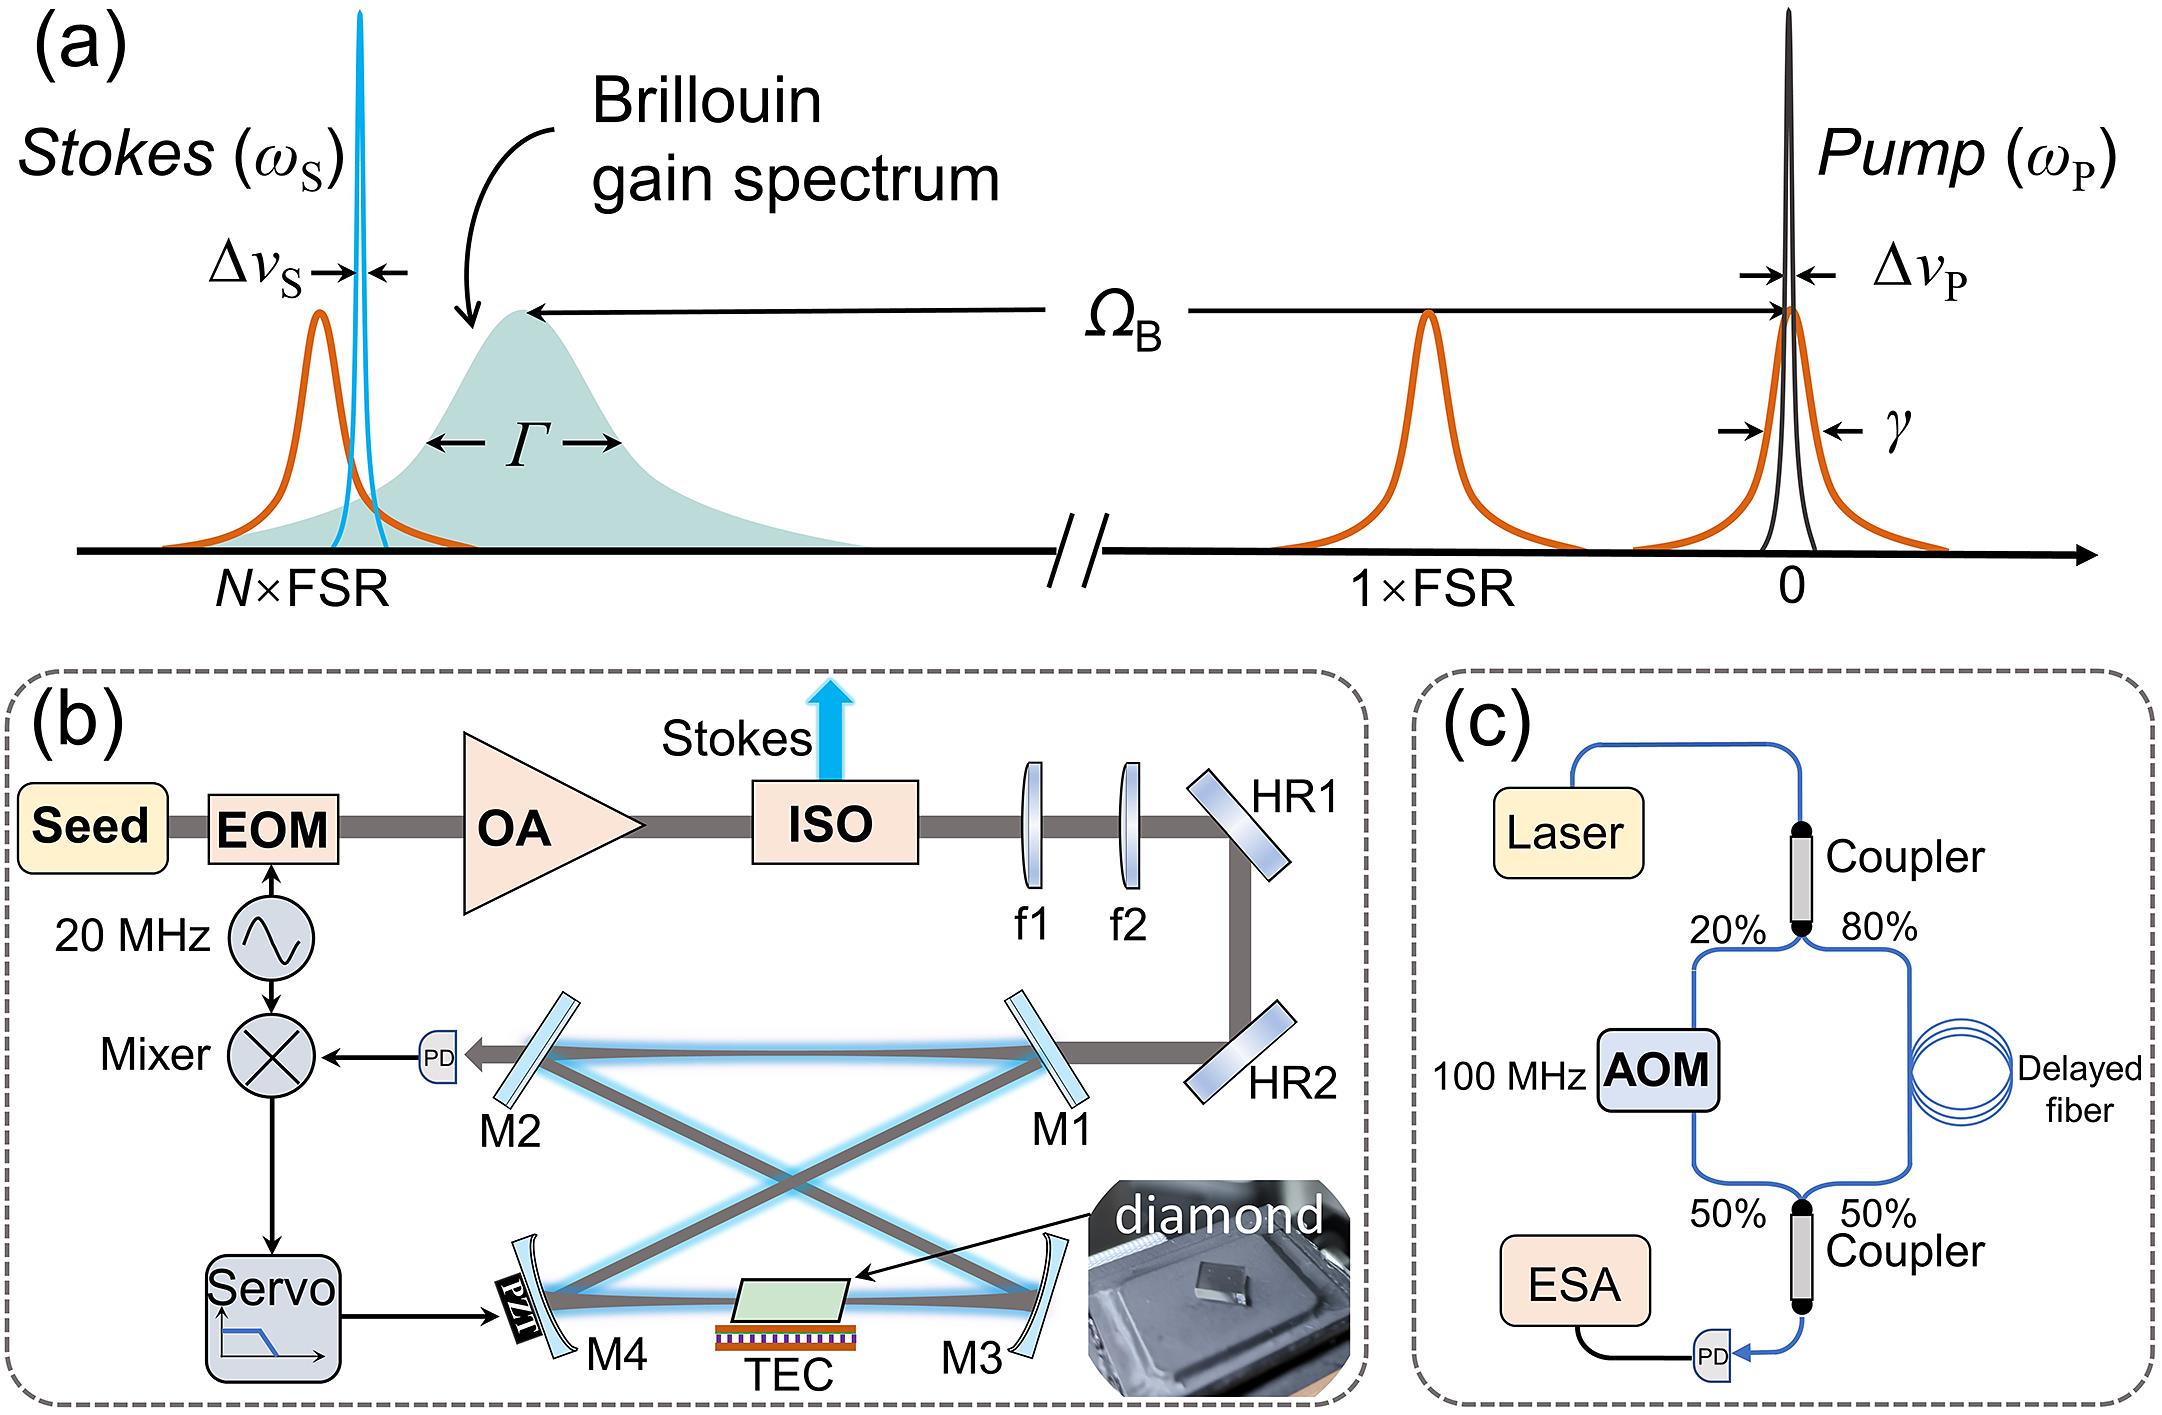
Fig. 1. Illustration of the phase match, experimental setup and linewidth measurement system of a free-space, free-running BL based on a diamond. (a) Demonstration of the Brillouin gain process. The grey curve refers to the cavity resonant mode with full width at half maximum (FWHM) γ. The red (blue) curves refer to pump (Stokes) frequency ω P (ω S) with the linewidth of Δν P (Δν S). The Brillouin gain spectrum linewidth (Γ ) and frequency shift (Ω B) are also indicated. (b) Schematic layout of a free-space, free-running BL based on a diamond (EOM, electronic optical modulator; OA, optical amplifier; ISO, isolator; f1 and f2, lenses; HR1 and HR2, high reflection mirrors; M1, coupler mirror; M2, high reflectivity plane mirror; M3 and M4, high reflectivity concave mirrors; PD, photodetector). (c) Linewidth measurement schematic. The beam is divided into two components using a 20%/80% coupler. The first component passes through an acoustic optical modulator (AOM) to generate a frequency shift of 100 MHz, and the second is delayed using a delay line (Nufern, 1060-XP). The beat note with a center frequency of 100 MHz is generated in the PD after the two components are recombined using a 3 dB coupler and analyzed by an electric spectrum analyzer (ESA) (RSA5032, Rigol).
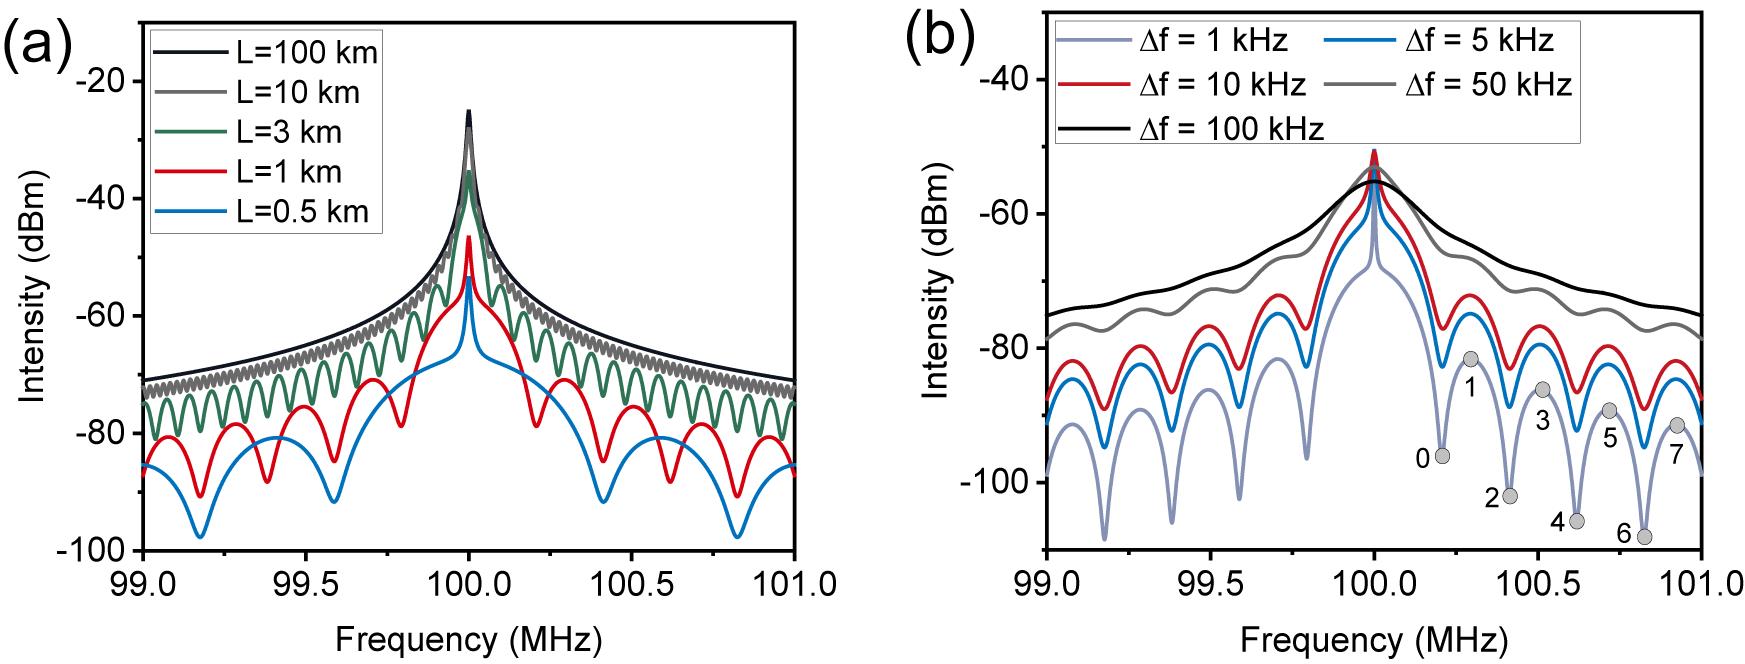
Fig. 2. (a) PSD at different fiber lengths for a linewidth of 1 kHz. (b) PSD spectrum at different laser linewidth values for a fiber length of 1 km.
Fig. 3. (a) Amplitude of the envelope differences and the frequency shift of the first extreme value point (m = 1) compared with the center at different fiber lengths for a linewidth of 5 kHz. (b) Experimentally measured linewidth values for a semiconductor laser corresponding to different fiber lengths.
Fig. 4. Stokes linewidth corresponding to the reflectivity of the three sets of coupling mirrors at 60 W power pumping. (a) Power spectrum of the corresponding delayed self-heterodyne amplitude difference. (b) Linewidth and envelope amplitude difference curves calculated by the coherent envelope method.
Fig. 5. Stokes power with different coupling mirror reflectivities.
Fig. 6. (a) Stokes output linewidth determined by passive loss and coupling mirror reflectivity. (b) Stokes output power determined by passive loss and coupling mirror reflectivity at a fixed pump power of 60 W.
|
Table 1. Stokes linewidths corresponding to different coupling mirror reflectivities.
| |||||||||||||||||||||||||||||||||||||||||||||||||||||||||||||||||||||||||||||||||||||||||||||||||
Table 2. Platform parameters and corresponding output linewidth and power in several BLs.

Set citation alerts for the article
Please enter your email address
© Copyright 2018-2021 | Chinese Laser Press. All Rights Reserved 沪ICP备15018463号-20