• Spectroscopy and Spectral Analysis
  • Vol. 41, Issue 10, 3021 (2021)
Hong-wei LIU1、* and Liang FU2、2; *;
Author Affiliations
  • 11. College of Material and Chemical Engineering, Hunan Institute of Technology, Hengyang 421002, China
  • 22. College of Materials Science and Engineering, Chongqing University, Chongqing 400045, China
  • show less
    DOI: 10.3964/j.issn.1000-0593(2021)10-3021-05 Cite this Article
    Hong-wei LIU, Liang FU. Analysis of Metal Impurity Elements in Li4Ti5O12 Through Microwave Plasma Atomic Emission Spectroscopy[J]. Spectroscopy and Spectral Analysis, 2021, 41(10): 3021 Copy Citation Text show less
    Spectral interferences for Pb 405.781 nm corrected using FLIC
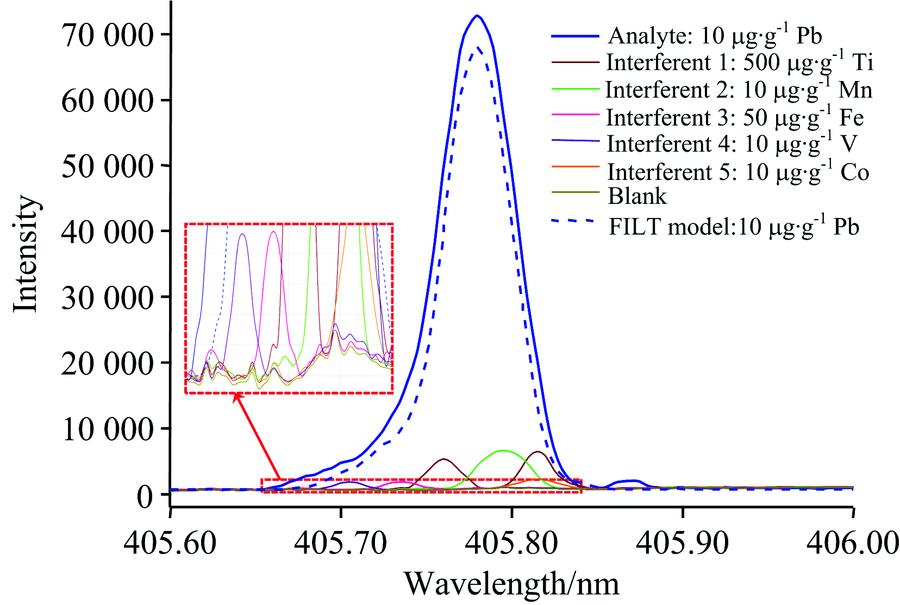
    Fig. 1. Spectral interferences for Pb 405.781 nm corrected using FLIC
    Correction effect of ionization suppression solution CsNO3 on ionization interferences
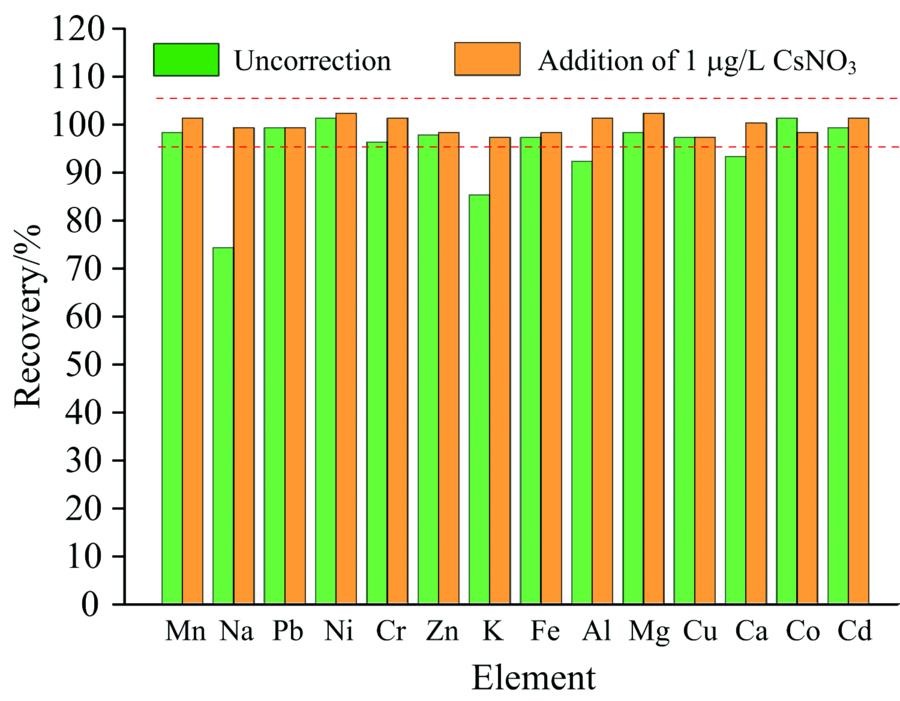
    Fig. 2. Correction effect of ionization suppression solution CsNO3 on ionization interferences
    Four-hour stability plot for analytes in Li4Ti5O12 sample solution
    Fig. 3. Four-hour stability plot for analytes in Li4Ti5O12 sample solution
    ElementLinear range
    /(μg·L-1)
    Coefficient
    (r)
    MDL
    /(μg·g-1)
    ElementLinear range
    /(μg·L-1)
    Coefficient
    (r)
    MDL
    /(μg·g-1)
    Mn0.30~2000.999 70.09Fe2.58~500.999 80.77
    Na0.16~2 0000.999 70.05Al0.70~2000.999 90.21
    Pb1.38~500.999 90.41Mg0.17~2000.999 50.05
    Ni1.03~500.999 80.31Cu1.30~2000.999 30.39
    Cr0.52~500.999 90.16Ca0.27~2000.999 70.08
    Zn0.93~500.999 50.28Cd0.40~500.999 80.12
    K0.10~10 0000.999 80.03Co0.82~500.999 60.25
    Table 1. Parameter of calibration curve and the method detect limit (MDL)
    ElementSpiked
    /(μg·L-1)
    Total found
    /(μg·L-1)
    RSD
    /%
    Recovery
    /%
    GB/T 30836—2014
    /(μg·L-1)
    t test
    Mn10098.7±2.602.6398.799.1±3.25p=0.41
    Na1 000966±21.22.1996.6974±36.8p=0.33
    Pb109.73±0.282.8897.39.96±0.18p=0.06
    Ni109.91±0.272.7299.110.2±0.33p=0.06
    Cr1010.2±0.343.3310210.3±0.30p=0.30
    Zn109.80±0.191.9498.010.1±0.32p=0.04
    K1 0001030±40.13.891031 060±53.6p=0.15
    Fe1010.2±0.323.1310210.4±0.26p=0.13
    Al100101±3.063.03101102±2.52p=0.28
    Mg100104±2.712.61104102±3.75p=0.16
    Cu10098.2±2.552.6098.2101±2.98p=0.06
    Ca10099.0±3.143.1799.096.6±3.69p=0.13
    Cd1010.3±0.292.8210310.1±0.24p=0.11
    Co109.64±0.171.7696.49.81±0.35p=0.15
    Table 2. Evaluation of the accuracy and precision of analytical methods (n=6)
    ElementSample ASample BElementSample ASample B
    FoundCertifiedFoundCertifiedFoundCertifiedFoundCertified
    Mn16.7±0.5116.439.1±1.1038.7Fe7.32±0.307.5012.8±0.4313.1
    Na659±21.0665287±10.4293Al14.3±0.4614.127.1±0.7328.0
    Pb9.22±0.359.434.11±0.184.17Mg38.2±1.0739.521.5±0.6222.1
    Ni1.13±0.021.101.08±0.032.11Cu11.6±0.4111.928.3±0.7929.4
    Cr6.27±0.196.324.31±0.144.28Ca20.8±0.7321.216.0±0.5115.7
    Zn5.13±0.165.082.08±0.072.11Cd1.34±0.031.332.09±0.052.12
    K4 160±16541902 530±90.22 600Co4.67±0.154.722.36±0.042.35
    Table 3. Analytical results of Li4Ti5O12 samples (μg·g-1, n=6)
    Hong-wei LIU, Liang FU. Analysis of Metal Impurity Elements in Li4Ti5O12 Through Microwave Plasma Atomic Emission Spectroscopy[J]. Spectroscopy and Spectral Analysis, 2021, 41(10): 3021
    Download Citation