
Wang Chengdong, Bao Zhenlin, Ma Jianpu, Zhang Kedong. Powder Separation and Its Suppression During Laser Cladding of Medical Ti/HA[J]. Chinese Journal of Lasers, 2020, 47(12): 1202001
- Chinese Journal of Lasers
- Vol. 47, Issue 12, 1202001 (2020)
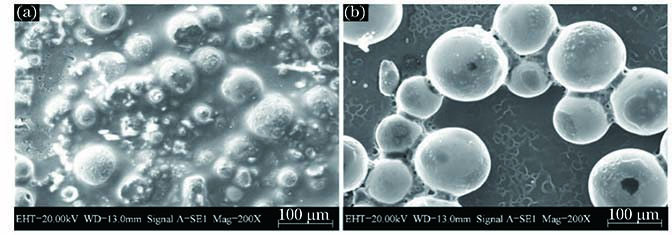
Fig. 1. Morphologies of powders. (a) HA powders; (b) Ti powders
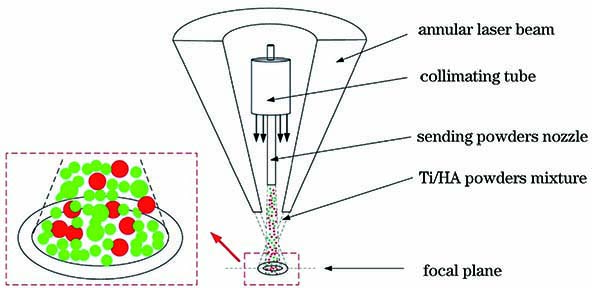
Fig. 2. Schematic of coaxial light feeding technology
Fig. 3. Physical diagrams of powders collection equipment. (a) Overall view; (b) enlarged view
Fig. 4. Map scanning of single-pass cladded 90%Ti+10%HA samples at same defocusing amount and scanning speed and different laser powers. (a) 400 W; (b) 600 W; (c) 800 W; (d) 1000 W
Fig. 5. Schematic of powders collection
Fig. 6. Map scanning images of powders. (a) Ca element map scanning image of HA powders; (b) Ti and Ca elements map scanning composite image of Ti/HA powders
Fig. 7. Particle size distribution map of HA powders
Fig. 8. Powders sample. (a)(c) Powders trajectory; (b)(d) powders partition region
Fig. 9. Mass ratio distribution maps in the central region of Ti/HA powders sample. (a) Random field of view 1; (b) random field of view 2
Fig. 10. SEM morphologies of Ti/HA powders and map scanning images of Ca and Ti elements. (a) Powders tube feeding; (b) manual powders laying
Fig. 11. Main factor diagram of powders separation model
Fig. 12. Effect graph and three-dimensional surface diagram of the relation between unseparated powders width and defocusing distance and scanning speed. (a) Effect graph; (b) three-dimensional surface diagram
Fig. 13. Powders trajectory. (a) vS=2 mm·s-1; (b) vS=6 mm·s-1
Fig. 14. Schematics of pre-mixed powders settling process at low and fast scanning speeds. (a) Low scanning speed; (b) fast scanning speed
Fig. 15. Map scanning images of mixed powders at different scanning speeds. (a) vS=4 mm·s-1; (b) vS=6 mm·s-1
Fig. 16. Map scanning images of mixed powders at different defocusing distances. (a) hD=-3 mm; (b) hD=-1.5 mm; (c) hD=0 mm
Fig. 17. Elements map scanning images of different zones of same powders sample. (a) Left zone; (b) middle zone; (c) right zone
|
Table 1. Main chemical composition of HA powders
|
Table 2. Main chemical composition of Ti powders
| |||||||||||||||||||
Table 3. Variables and levels of powders separation
|
Table 4. Box-Behnken design sequencing and results


Set citation alerts for the article
Please enter your email address

© Copyright 2018-2021 | Chinese Laser Press. All Rights Reserved 沪ICP备15018463号-20