• Spectroscopy and Spectral Analysis
  • Vol. 42, Issue 11, 3494 (2022)
Wei ZHU1; 2;, Rui-fang YANG1; *;, Nan-jing ZHAO1; *;, Gao-fang YIN1;, Xue XIAO1;, Jian-guo LIU1;, and Wen-qing LIU1;
Author Affiliations
  • 1. School of Environmental Science and Optoelectronic Technology, University of Science and Technology of China, Hefei 230026, China
  • show less
    DOI: 10.3964/j.issn.1000-0593(2022)11-3494-07 Cite this Article
    Wei ZHU, Rui-fang YANG, Nan-jing ZHAO, Gao-fang YIN, Xue XIAO, Jian-guo LIU, Wen-qing LIU. Study on Small Sample Analysis Method for Identification of Polycyclic Aromatic Hydrocarbons in Water[J]. Spectroscopy and Spectral Analysis, 2022, 42(11): 3494 Copy Citation Text show less
    The similarity coefficients between extracted emission and excitation spectra of six components and the corresponding standard spectra with component numbers from 6 to 9 for samples X1 and X2
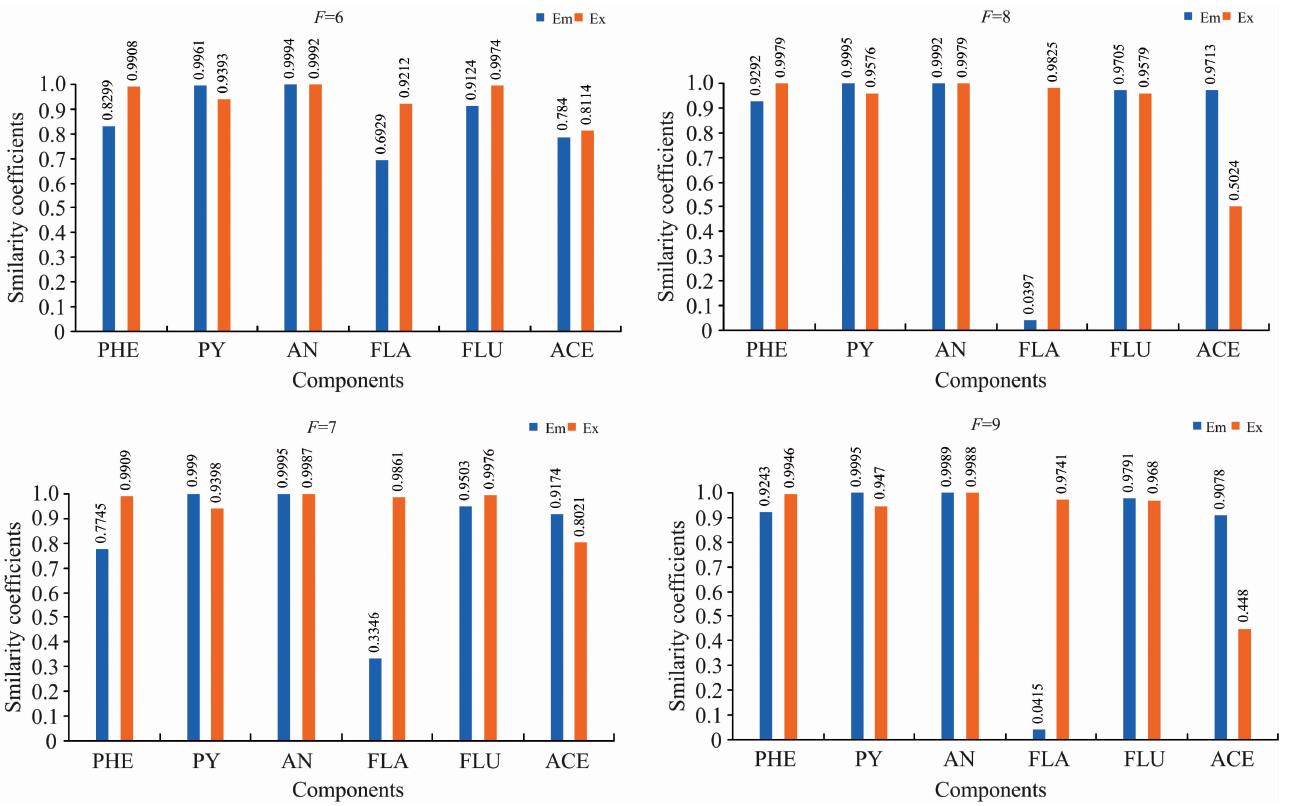
    Fig. 1. The similarity coefficients between extracted emission and excitation spectra of six components and the corresponding standard spectra with component numbers from 6 to 9 for samples X1 and X2
    The extracted emission (PHE/PY/AN/FLA/FLU/ACE) and excitation (PHE/PY/AN/FLA/FLU/ACE) spectra of six components (blue lines) and the corresponding standard spectra (red lines) with component number 8 for samples X1, X2 and two pseudo samples
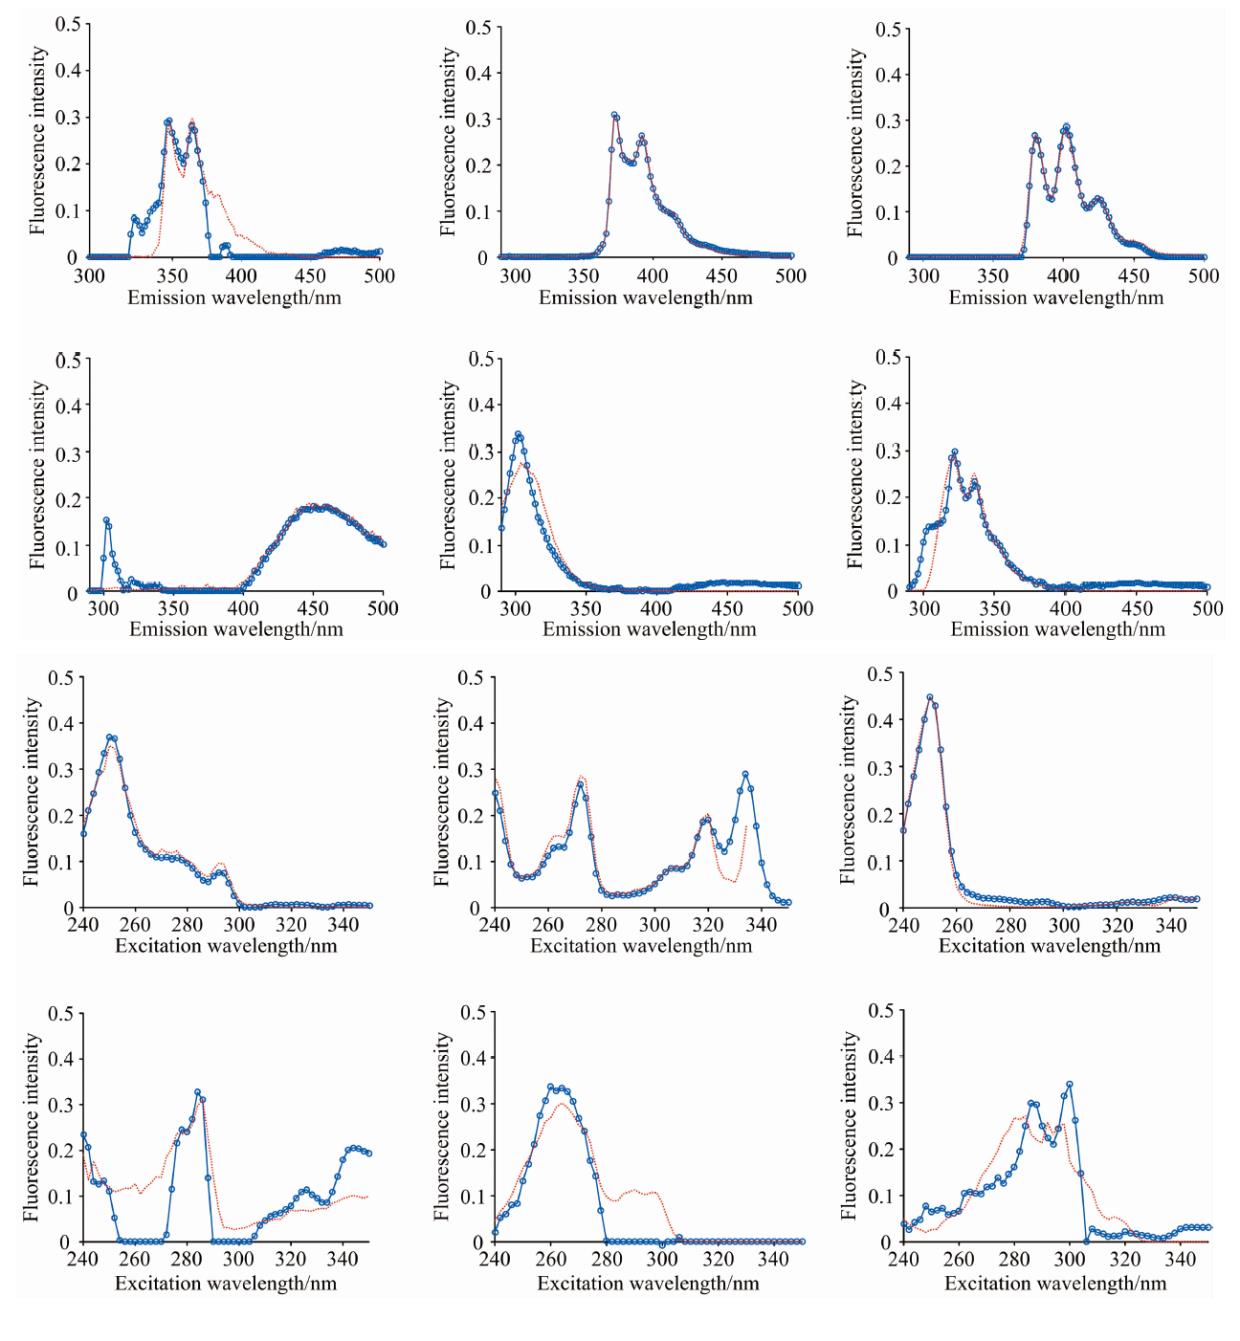
    Fig. 2. The extracted emission (PHE/PY/AN/FLA/FLU/ACE) and excitation (PHE/PY/AN/FLA/FLU/ACE) spectra of six components (blue lines) and the corresponding standard spectra (red lines) with component number 8 for samples X1, X2 and two pseudo samples
    The similarity coefficients between extracted emission and excitation spectra of six components and the corresponding standard spectra with component numbers from 6 to 9 for samples X1, X2 and two pseudo samples
    Fig. 3. The similarity coefficients between extracted emission and excitation spectra of six components and the corresponding standard spectra with component numbers from 6 to 9 for samples X1, X2 and two pseudo samples
    The similarity coefficients between extracted emission and excitation spectra of six components and the corresponding standard spectra with component numbers from 6 to 9 for samples X3 and X4
    Fig. 4. The similarity coefficients between extracted emission and excitation spectra of six components and the corresponding standard spectra with component numbers from 6 to 9 for samples X3 and X4
    The similarity coefficients between extracted emission and excitation spectra of six components and the corresponding standard spectra with component numbers from 6 to 9 for samples X3, X4 and two pseudo samples
    Fig. 5. The similarity coefficients between extracted emission and excitation spectra of six components and the corresponding standard spectra with component numbers from 6 to 9 for samples X3, X4 and two pseudo samples
    The similarity coefficients between extracted emission and excitation spectra of six components and the corresponding standard spectra with component numbers from 6 to 9 for samples X5 and X6
    Fig. 6. The similarity coefficients between extracted emission and excitation spectra of six components and the corresponding standard spectra with component numbers from 6 to 9 for samples X5 and X6
    The similarity coefficients between extracted emission and excitation spectra of six components and the corresponding standard spectra with component numbers from 6 to 9 for samples X5, X6 and two pseudo samples
    Fig. 7. The similarity coefficients between extracted emission and excitation spectra of six components and the corresponding standard spectra with component numbers from 6 to 9 for samples X5, X6 and two pseudo samples
    12345678
    X10.836 00.980 70.991 60.996 70.998 70.999 60.999 70.999 7
    X20.932 10.986 60.996 10.998 70.999 20.999 60.999 60.999 7
    Table 1. The first 8 cumulative contribution rates of singular values for the first set samples X1 and X2
    12345678
    X30.831 80.960 20.984 80.992 80.997 90.999 10.999 40.999 5
    X40.844 80.981 00.995 50.997 90.999 00.999 30.999 60.999 7
    Table 2. The first 8 cumulative contribution rates of singular values for the first set samples X3 and X4
    12345678
    X50.842 20.962 50.988 40.997 90.999 20.999 50.999 60.999 7
    X60.870 50.969 00.996 50.998 80.999 40.999 70.999 80.999 8
    Table 3. The first 8 cumulative contribution rates of singular values for the first set samples X5 and X6
    Wei ZHU, Rui-fang YANG, Nan-jing ZHAO, Gao-fang YIN, Xue XIAO, Jian-guo LIU, Wen-qing LIU. Study on Small Sample Analysis Method for Identification of Polycyclic Aromatic Hydrocarbons in Water[J]. Spectroscopy and Spectral Analysis, 2022, 42(11): 3494
    Download Citation