
Zhongqi Wang, Yanting Lu. Non-Modulation Pyramid Wavefront Sensor Based on Phase Retrieval[J]. Acta Optica Sinica, 2023, 43(4): 0428001
- Acta Optica Sinica
- Vol. 43, Issue 4, 0428001 (2023)
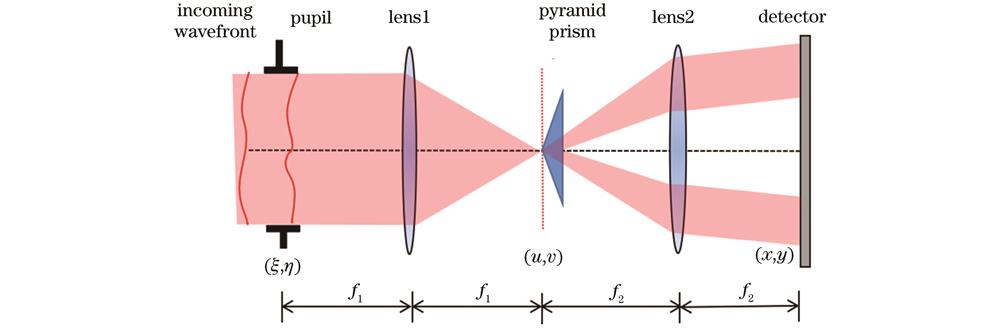
Fig. 1. Schematic of structure of Py-GS
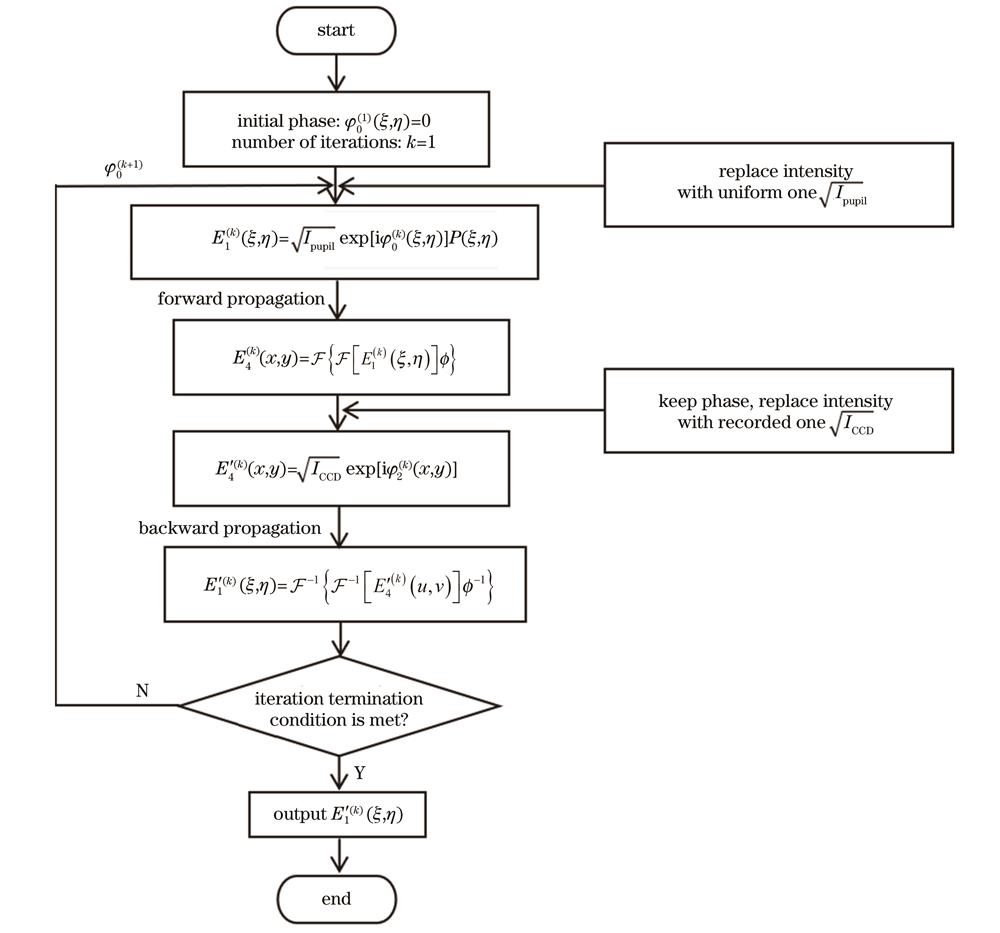
Fig. 2. Flow chart of Py-GS algorithm
Fig. 3. Simulation images of intensity distribution of Py-GS detector. (a) No wavefront aberration; (b) defocus aberration
Fig. 4. Reconstruction results of random combination aberration. (a) Input phase; (b) reconstructed phase; (c) phase residual; (d) curve of evaluation function
Fig. 5. Reconstruction results of random phase of atmosphere turbulence. (a) Input phase; (b) reconstructed phase; (c) phase residual; (d) curve of evaluation function
Fig. 6. Reconstruction results of phase of freeform surface. (a) Input phase; (b) reconstructed phase; (c) phase residual; (d) curve of evaluation function
Fig. 7. Curves of evaluation function of two algorithms for measured wavefronts with different amplitudes. (a) Py-GS algorithm; (b) Con-GS algorithm
Fig. 8. Spots at pyramid tip and intensity distributions of detector under different tilt angles. (a)-(c) Spots at pyramid tip under different tilt angles; (d)-(f) intensity distributions on detector under different tilt angles
Fig. 9. Results of conventional pyramid wavefront reconstruction algorithm for different composite phases to be measured. (a)-(c) Phases to be measured; (d)-(f) intensity distributions of detector; (g)-(i) slopes of horizontal wavefront; (j)-(l) cross sections of slopes of horizontal wavefront
Fig. 10. Reconstruction results of wavefront obtained by Py-GS under different SNR conditions. (a)-(c) Intensity distributions on detector; (d)-(f) reconstructed wavefronts; (g)-(i) residuals
Fig. 11. Influence of central platform on reconstruction results. (a) RMS of reconstructed residual under different size of central platform; (b) PV of reconstructed residual under different size of central platform
|
Table 1. Reconstruction results of composite wavefronts to be measured in Fig. 9 obtained by Py-GS
|
Table 2. RMS of reconstructed residual of Py-GS under different SNR conditions

Set citation alerts for the article
Please enter your email address
© Copyright 2018-2021 | Chinese Laser Press. All Rights Reserved 沪ICP备15018463号-20