
Qinying Liu, Shiyu Liu, Yongkang Luo, Xiaotao Han. Pulsed-field nuclear magnetic resonance: Status and prospects[J]. Matter and Radiation at Extremes, 2021, 6(2): 024201
- Matter and Radiation at Extremes
- Vol. 6, Issue 2, 024201 (2021)
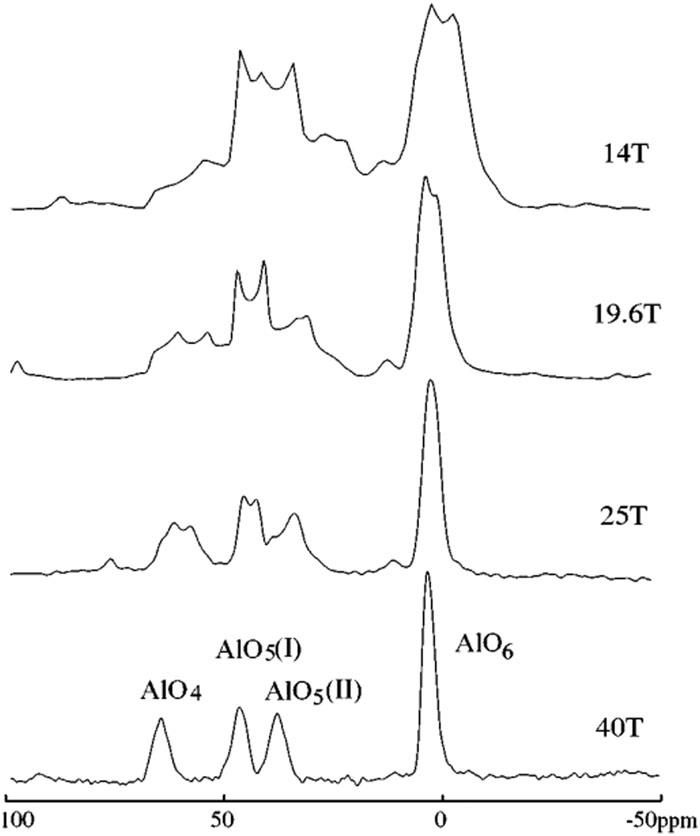
Fig. 1. 27Al MAS-NMR spectra from 14 T to 40 T. Reprinted with permission from Gan et al. , J. Am. Chem. Soc. 124 , 5634 (2002). Copyright 2002 American Chemical Society.
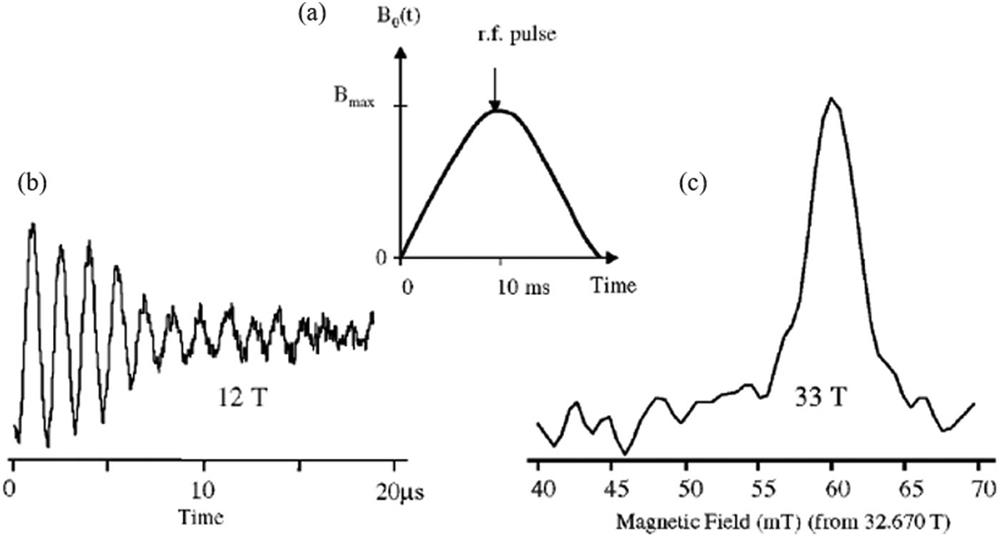
Fig. 2. (a) Background pulsed magnetic field. (b) 63Cu FID at 12 T; (c) Fourier transform of 63Cu FID at 33 T. Reprinted with permission from Haas et al. , J. Magn. Magn. Mater. 272-276 , e1623 (2004). Copyright 2004 Elsevier.
Fig. 3. 1H FID under a 50 T pulsed high magnetic field. Reprinted with permission from Haas et al. , Solid State Nucl. Magn. Reson. 28 , 64 (2005). Copyright 2005 Elsevier.
Fig. 4. (a) 59Co NMR spectra under a steady field. Reprinted with permission from Kawasaki et al. , Phys. Rev. B 79 , 220514 (2009). Copyright 2009 American Physical Society. (b) 59Co NMR spectra under a pulsed field. Reprinted with permission from Zheng et al. , J. Phys. Soc. Jpn. 78 , 095001 (2009). Copyright 2009 The Physical Society of Japan.
Fig. 5. Scheme of the pulsed NMR spectrometer at HLD. Reprinted with permission from Meier et al. , Rev. Sci. Instrum. 83 , 083113 (2012). Copyright 2012 AIP Publishing LLC.
Fig. 6. Scheme of the pulsed NMR spectrometer at LNCMI. Reprinted with permission from Stork et al. , J. Magn. Reson. 234 , 30 (2013). Copyright 2013 Elsevier.
Fig. 7. Magnetic field homogeneity of the pulsed magnet at LNCMI at 12.5 T and 47 T. Reprinted with permission from Orlova et al. , J. Magn. Reson. 268 , 82 (2016). Copyright 2016 Elsevier.
Fig. 8. (a) Initial value of the induced electromotive force measured synchronously with the FID signal. Reprinted with permission from Iijima et al. , J. Magn. Reson. 184 , 258 (2007). Copyright 2007 Elsevier. (b) 1H spectrum before and after deconvolution. Reprinted with permission from Stork et al. , J. Magn. Reson. 234 , 30 (2013). Copyright 2013 Elsevier.
Fig. 9. Spectrogram of the FID signal of a single-pulse peak segment: (a) 7 T; (b) 62 T. Reprinted with permission from Meier et al. , J. Magn. Reson. 210 , 1 (2011). Copyright 2011 Elsevier.
Fig. 10. (a) FID signals of Linde A (weak, left) and 27Al (strong, right) under a 55.7 T pulsed field. (b) Adiabatic reversal experiment for measuring T 1 in a pulsed field. Reprinted with permission from Kohlrautz et al. , J. Magn. Reson. 263 , 1 (2016). Copyright 2016 Elsevier.
Fig. 11. Overview of procedure for reconstruction of broad spectra in a pulsed magnetic field using the normalized deconvolution method. For more details, see Ref. 53 . Reprinted with permission from Kohlrautz et al. , J. Magn. Reson. 271 , 52 (2016). Copyright 2016 Elsevier.
Fig. 12. (a) EIIAGlc titration results with an 800 MHz NMR spectrometer. (b) Surface mapped by residues with chemical shift perturbations >3 Hz. Reprinted with permission from Xing et al. , Angew. Chem., Int. Ed. 53 , 1 (2014). Copyright 2014 John Wiley and Sons.
Fig. 13. Resonance spectra of YBa2Cu3Ox in a pulsed 47 T field. The black solid line is the sum of several experiments (2.5 K). Reprinted with permission from Stork et al. , J. Magn. Reson. 234 , 30 (2013). Copyright 2013 Elsevier.
Fig. 14. (a) CeIn3 NMR spectra (56 T) at different temperatures. (b) CeIn3 NMR spectra (1.5 K) at different magnetic field intensities. Reprinted with permission from Tokunaga et al. , Phys. Rev. B 99 , 085142 (2019). Copyright 2019 American Physical Society.
Fig. 15. (a) Curve of average magnetization of SrCu2(BO3)2 vs magnetic intensity.81–84 (b) NMR spectra of 11B under pulsed 54 T (blue) and steady 41 T (black) magnetic fields (2 K). (c) Magnetic superlattice in the 1/3 magnetization plateau. Reprinted with permission from Kohlrautz et al. , J. Magn. Reson. 271 , 52 (2016). Copyright 2016 Elsevier.
Fig. 16. Field dependence of the normalized spin polarization S z / S z sat H int obtained from the 51V PF-NMR spectra in LiCuVO4 (H ‖ c ). Reprinted with permission from Orlova et al. , Phys. Rev. Lett. 118 , 247201 (2017). Copyright 2017 American Physical Society.
Fig. 17. Structure of a traditional NMR spectrometer.
Fig. 18. NMR detection environment in a pulsed magnetic field.
|
Table 1. NMR signal processing strategies in unstable magnetic fields.
|
Table 2. Research status of NMR in unsteady high magnetic fields worldwide.
|
Table 3. Progress in FTPMF research worldwide.

Set citation alerts for the article
Please enter your email address
© Copyright 2018-2021 | Chinese Laser Press. All Rights Reserved 沪ICP备15018463号-20