• Laser & Optoelectronics Progress
  • Vol. 59, Issue 10, 1028010 (2022)
Dongna Xiao1、2, Zhongfa Zhou1、2、*, Linjiang Yin1、2, Denghong Huang1、2, Yang Zhang1、2, and Qianxia Li1、2
Author Affiliations
  • 1School of Karst Science/School of Geography & Environmental Science, Guizhou Normal University, Guiyang 550001, Guizhou , China
  • 2State Engineering Technology Institute For for Karst Desertification Control, Guizhou Normal University, Guiyang 550001, Guizhou , China
  • show less
    DOI: 10.3788/LOP202259.1028010 Cite this Article Set citation alerts
    Dongna Xiao, Zhongfa Zhou, Linjiang Yin, Denghong Huang, Yang Zhang, Qianxia Li. Identification of Single Plant of Karst Mountain Pitaya by Fusion of Color Index and Spatial Structure[J]. Laser & Optoelectronics Progress, 2022, 59(10): 1028010 Copy Citation Text show less
    Location diagram of study area. (a) DEM of Huajiang demonstration area; (b) visible remote sensing image of study area
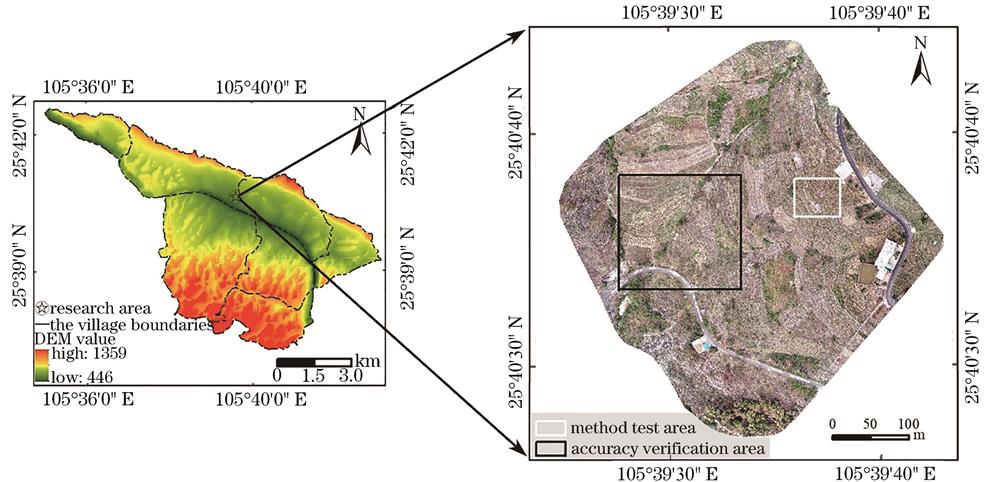
    Fig. 1. Location diagram of study area. (a) DEM of Huajiang demonstration area; (b) visible remote sensing image of study area
    Method test area and profile of its point cloud data. (a) Visible remote sensing image; (b) image matching point cloud data;(c) point cloud data profile
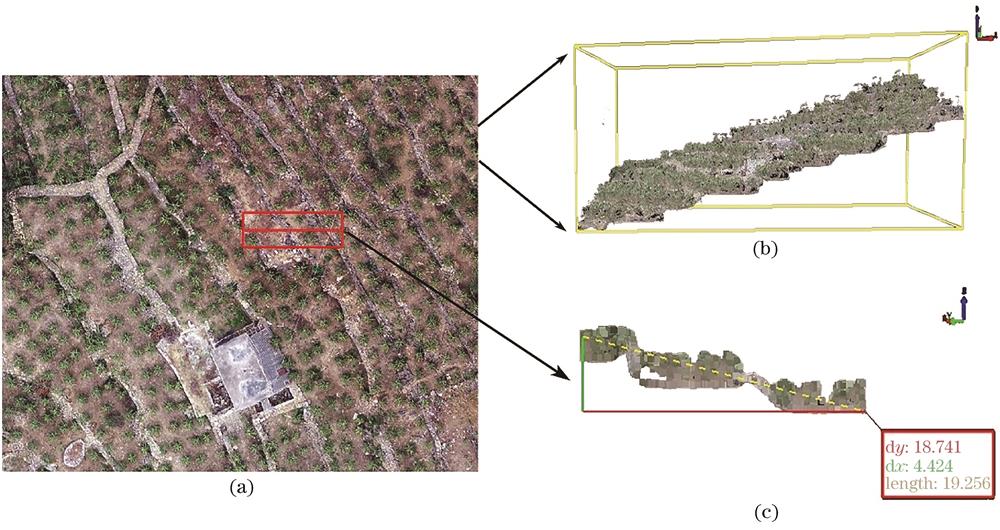
    Fig. 2. Method test area and profile of its point cloud data. (a) Visible remote sensing image; (b) image matching point cloud data;(c) point cloud data profile
    Schematic of extraction method of color index and CHM segmentation intersection fusion
    Fig. 3. Schematic of extraction method of color index and CHM segmentation intersection fusion
    Technology roadmap
    Fig. 4. Technology roadmap
    Precision test standard of segmentation. (a) Match; (b) over matching; (c) over segmentation; (d) wrong segmentation; (e) missed inspection
    Fig. 5. Precision test standard of segmentation. (a) Match; (b) over matching; (c) over segmentation; (d) wrong segmentation; (e) missed inspection
    Histograms of number of pixels with different color indices. (a) VDVI; (b) NGBDI; (c) NGRDI; (d) RGBVI
    Fig. 6. Histograms of number of pixels with different color indices. (a) VDVI; (b) NGBDI; (c) NGRDI; (d) RGBVI
    Extraction results of vegetation index. (a) VDVI; (b) NGBDI; (c) NGRDI; (d) RGBVI
    Fig. 7. Extraction results of vegetation index. (a) VDVI; (b) NGBDI; (c) NGRDI; (d) RGBVI
    Preprocessing results of point cloud data. (a) DEM; (b) DSM; (c) CHM; (d) CHM segmentation
    Fig. 8. Preprocessing results of point cloud data. (a) DEM; (b) DSM; (c) CHM; (d) CHM segmentation
    Segmentation results of fusion of each color index and CHM segmentation. (a) VDVI_CHM; (b) NGBDI_CHM;(c) NGRDI_CHM; (d) RGBVI_CHM
    Fig. 9. Segmentation results of fusion of each color index and CHM segmentation. (a) VDVI_CHM; (b) NGBDI_CHM;(c) NGRDI_CHM; (d) RGBVI_CHM
    Comparison of extraction results between local fusion method and single factor extraction
    Fig. 10. Comparison of extraction results between local fusion method and single factor extraction
    Box scatter diagram of four fusion results extraction and true value fitting degree
    Fig. 11. Box scatter diagram of four fusion results extraction and true value fitting degree
    Extraction process diagram and segmentation results of accuracy verification area. (a) DEM; (b) CHM; (c) VDVI; (d) VDVI_CHM
    Fig. 12. Extraction process diagram and segmentation results of accuracy verification area. (a) DEM; (b) CHM; (c) VDVI; (d) VDVI_CHM
    Training sample regionRed light bandGreen light bandBlue light band
    Pitaya area0.2350.2130.251
    Weeds0.1910.1540.189
    Bare land0.1000.1220.138
    Gravel ladder insuperior0.1800.1960.189
    Constructions0.1260.1220.107
    Table 1. Variation coefficient of reflection value in visible light band of training sample area
    Vegetation indexEquation
    VDVI(2×G-R-B)/(2×G+R+B)
    NGBDIG-B/G+B
    NGRDI(G-R)/(G+R)
    RGBVI(G×R-R×B)/(G×G+R×B)
    Table 2. Calculation formula of vegetation indexs
    Segmentation typePPPCSESCLPRF
    VDVI59.3834.060.006.560.0059.3839.8347.68
    NGBDI61.0037.670.001.330.6361.0038.3647.10
    NGRDI69.7221.880.008.404.1969.7257.4462.99
    RGBVI58.6939.020.002.300.6358.6937.5345.78
    Table 3. Accuracy table of pitaya tree number extracted by each vegetation index
    ParameterPPPCSESCLPRF
    Value36.2139.422.3722.001.0536.2144.8640.07
    Table 4. Precision table of CHM segmentation
    Segmentation typePPPCSESCLPRF
    VDVI_CHM94.061.703.181.061.0594.0692.8793.46
    NGBDI_CHM93.052.952.741.261.0593.0592.6692.86
    NGRDI_CHM93.601.772.212.436.9293.6088.8991.18
    RGBVI_CHM92.263.351.263.141.6892.2692.4592.36
    Table 5. Accuracy table of extraction based on CHM segmentation and fusion of four color indices
    Segmentation typeIncrease in relative vegetation indexIncrease relative to CHM segmentation
    PRFPRF
    VDVI34.6853.0445.7857.8548.0153.39
    NGBDI32.0554.3045.7556.8447.8052.78
    NGRDI23.8831.4528.1957.3944.0351.11
    RGBVI33.5754.9346.5856.0547.5952.28
    Table 6. Comparison table of segmentation fusion results and extraction accuracy of single factor
    ParameterMean valueStandard deviationVarianceSkewnessPeakedness
    True_AREA133.80037.4961405.9310.6450.893
    VDVI_AREA144.29348.2442327.4460.6170.520
    RGBVI_AREA143.47249.8442484.4710.8621.874
    NGBDI_AREA143.57151.0182602.8081.0061.909
    NGRDI_AREA110.84155.5693087.9241.5023.984
    Table 7. Description and analysis of basic data of real value and area value extracted by fusion
    Dongna Xiao, Zhongfa Zhou, Linjiang Yin, Denghong Huang, Yang Zhang, Qianxia Li. Identification of Single Plant of Karst Mountain Pitaya by Fusion of Color Index and Spatial Structure[J]. Laser & Optoelectronics Progress, 2022, 59(10): 1028010
    Download Citation