• Acta Optica Sinica
  • Vol. 40, Issue 3, 0334001 (2020)
Yuecheng Lin1、4, Yajun Tong2, Te Ji1、3, Weiwei Peng1、3, Tiqiao Xiao1、3, Huachun Zhu1、3、*, and Min Chen1、3、**
Author Affiliations
  • 1Shanghai Institute of Applied Physics, Chinese Academy of Sciences, Shanghai 201800, China
  • 2Shanghai Tech University, Shanghai 201210, China
  • 3Shanghai Synchrotron Radiation Facility, Shanghai Advanced Research Institute, Chinese Academy of Sciences, Shanghai 201204, China
  • 4University of Chinese Academy of Sciences, Beijing 100049, China
  • show less
    DOI: 10.3788/AOS202040.0334001 Cite this Article Set citation alerts
    Yuecheng Lin, Yajun Tong, Te Ji, Weiwei Peng, Tiqiao Xiao, Huachun Zhu, Min Chen. Synchrotron Radiation Infrared Three-Dimensional Microspectroscopy Based on Point Scanning Method[J]. Acta Optica Sinica, 2020, 40(3): 0334001 Copy Citation Text show less
    Experimental setup of BL01B in SSRF
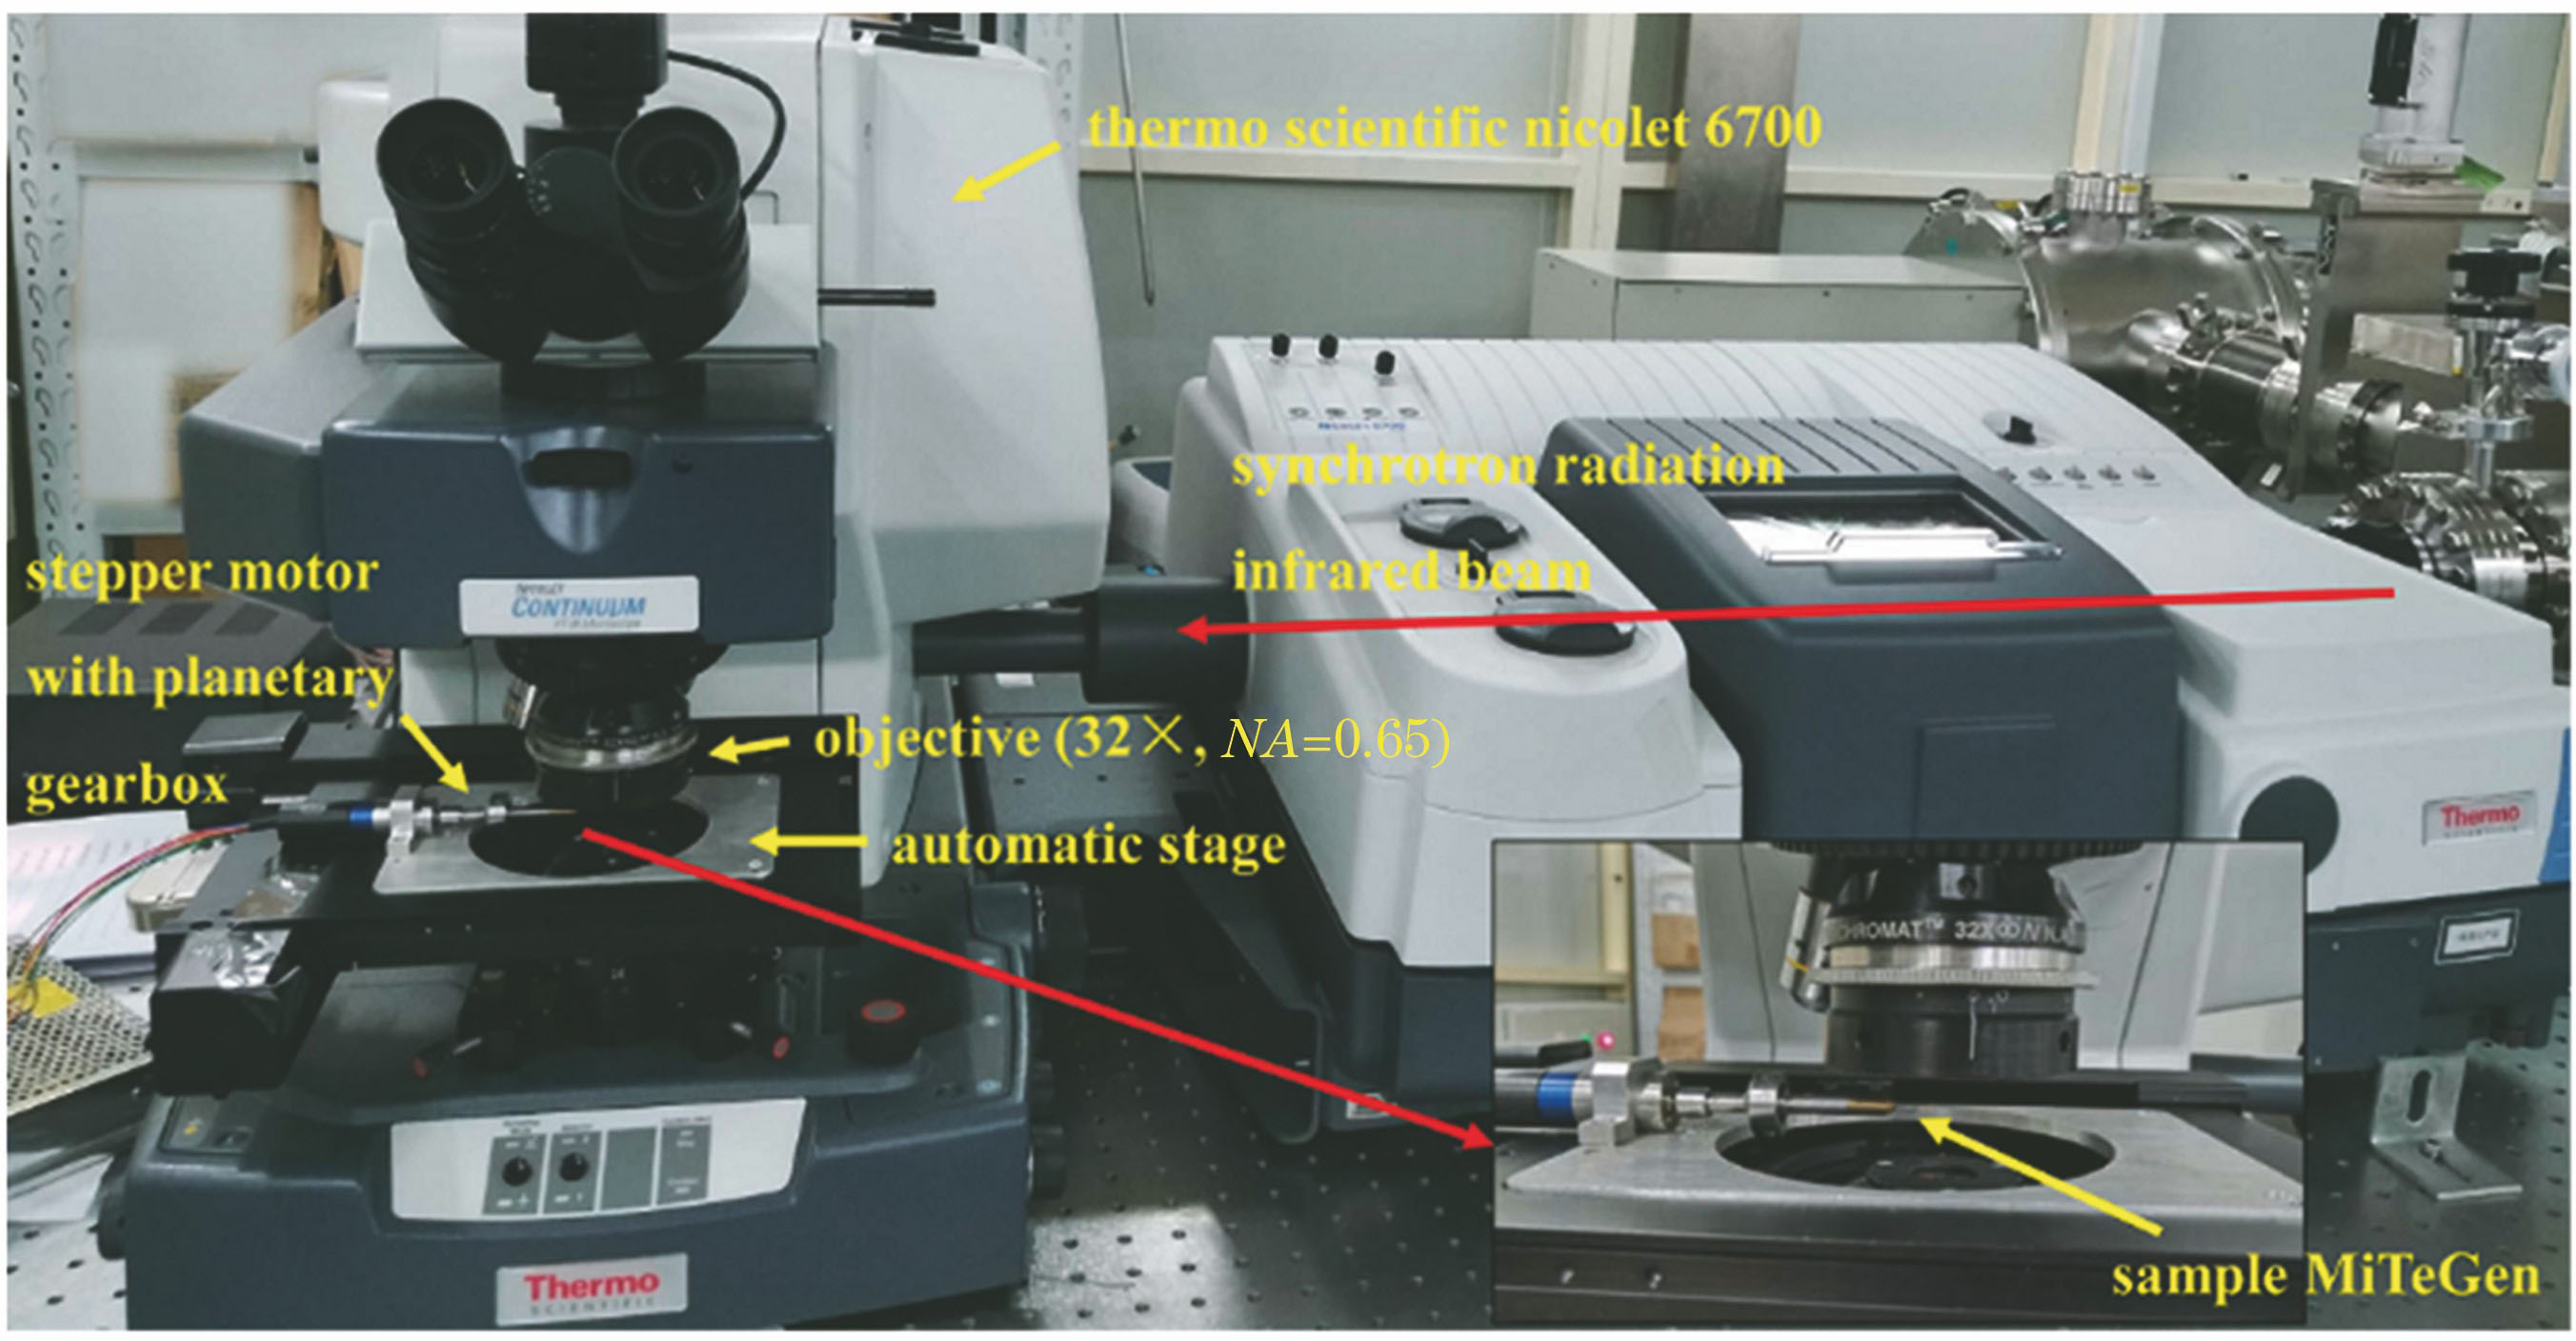
    Fig. 1. Experimental setup of BL01B in SSRF
    SRIR light transmission schematic and chemical structure of imide ring. (a) Schematic of SRIR light transmission; (b) chemical structure of imide loop
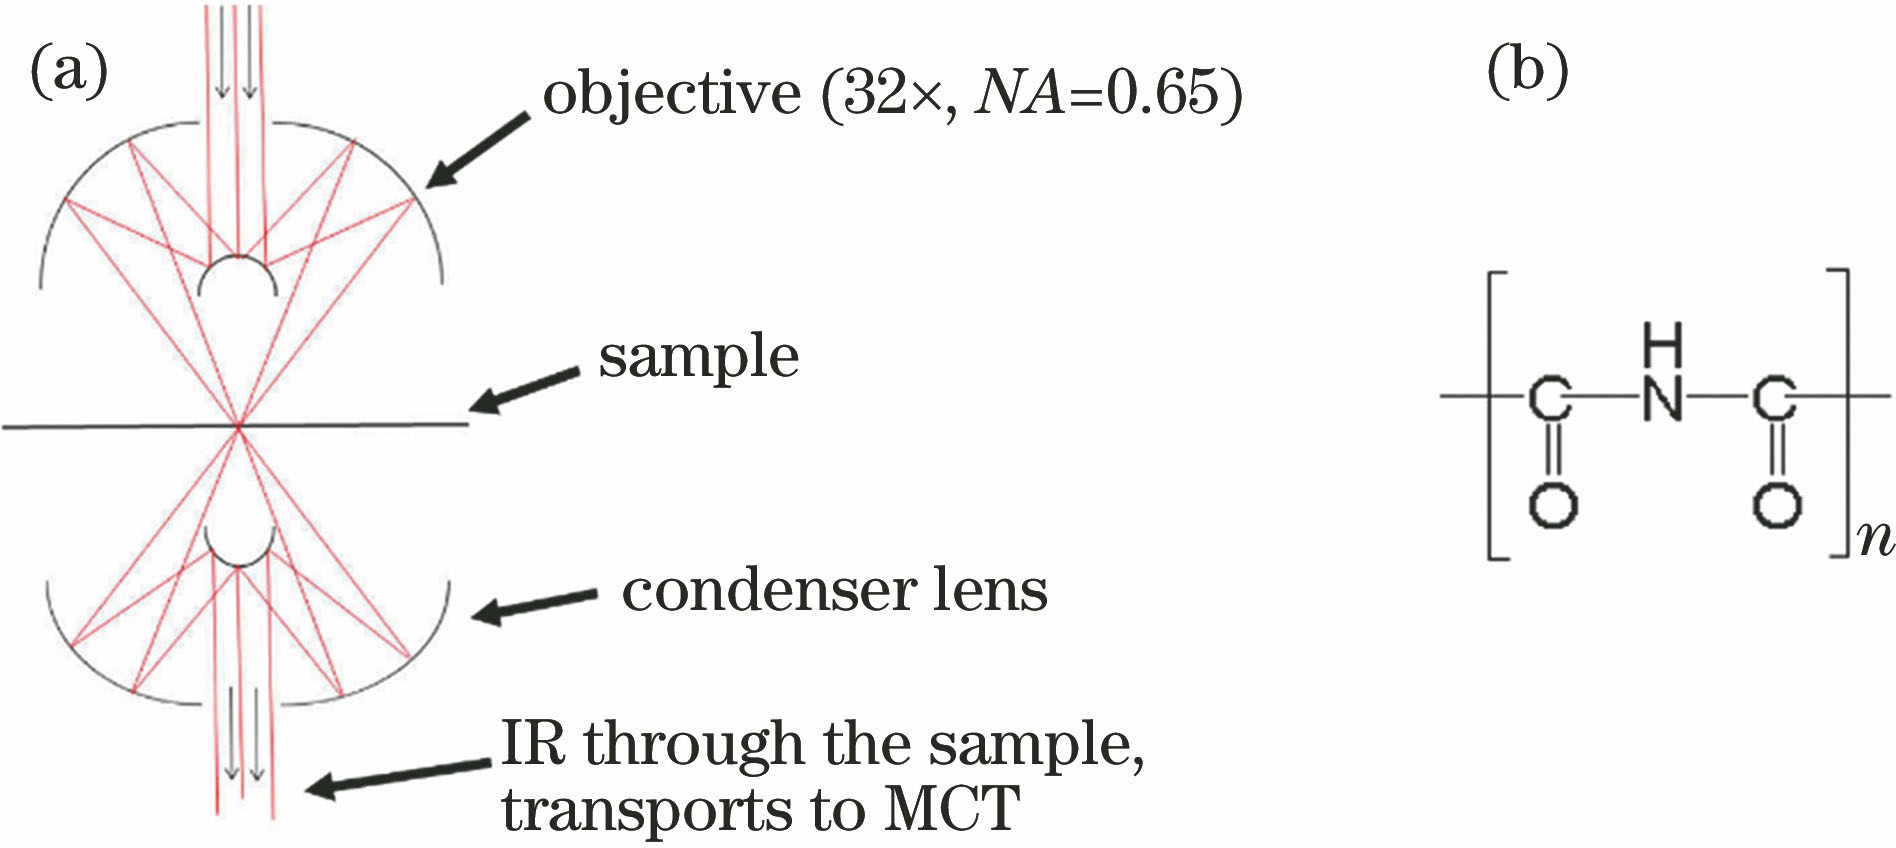
    Fig. 2. SRIR light transmission schematic and chemical structure of imide ring. (a) Schematic of SRIR light transmission; (b) chemical structure of imide loop
    IR spectrum of MiTeGen loop in wavenumber range of 1900--1000 cm-1
    Fig. 3. IR spectrum of MiTeGen loop in wavenumber range of 1900--1000 cm-1
    MiTeGen loop. (a) Front view of visible image of MiTeGen loop; (b) SRIR microscopic spectrum of amide Ⅱ at wavenumber of 1490 cm-1
    Fig. 4. MiTeGen loop. (a) Front view of visible image of MiTeGen loop; (b) SRIR microscopic spectrum of amide Ⅱ at wavenumber of 1490 cm-1
    SRIR 3D microscopic reconstruction of amide Ⅱ. (a) 0° side view; (b) 45° side view; (c) 135° side view
    Fig. 5. SRIR 3D microscopic reconstruction of amide Ⅱ. (a) 0° side view; (b) 45° side view; (c) 135° side view
    Reconstruction images of amide Ⅱ at different depths. (a) Whole reconstruction image of amide Ⅱ; (b) 7.5 μm;(c) 10 μm; (d) 12.5 μm; (e) 15 μm; (f) 17.5 μm; (g) 22 μm; (h) 25 μm; (i) 27.5 μm; (j) 32.5 μm
    Fig. 6. Reconstruction images of amide Ⅱ at different depths. (a) Whole reconstruction image of amide Ⅱ; (b) 7.5 μm;(c) 10 μm; (d) 12.5 μm; (e) 15 μm; (f) 17.5 μm; (g) 22 μm; (h) 25 μm; (i) 27.5 μm; (j) 32.5 μm
    Arrangement of effective tomography images and intensity curve of tomography slice 8. (a) Ordered arrangement of 15 effective synchrotron radiation absorption tomography images of amide Ⅱ; (b) synchrotron radiation infrared microspectroscopy intensity profile of tomography slice 8
    Fig. 7. Arrangement of effective tomography images and intensity curve of tomography slice 8. (a) Ordered arrangement of 15 effective synchrotron radiation absorption tomography images of amide Ⅱ; (b) synchrotron radiation infrared microspectroscopy intensity profile of tomography slice 8
    WavenumberComponentChemical bond
    1664--1538 cm-1Amide IN—H bend
    1538--1452 cm-1Amide ⅡCoupling between N—H and C—N
    1476--1372 cm-1AmideC—N stretch
    1381--1223 cm-1Amide ШCoupling between N—H and C—N
    Table 1. Main components of MiTeGen loop in wavenumber range of 1900-1000 cm-1
    Yuecheng Lin, Yajun Tong, Te Ji, Weiwei Peng, Tiqiao Xiao, Huachun Zhu, Min Chen. Synchrotron Radiation Infrared Three-Dimensional Microspectroscopy Based on Point Scanning Method[J]. Acta Optica Sinica, 2020, 40(3): 0334001
    Download Citation