• Acta Optica Sinica
  • Vol. 43, Issue 6, 0612001 (2023)
Yiren Wang1、2, Ming Yang3, Daxin Liu4、*, Yingwei Xia1, Wanyi Xie1、2, Hongkun Wang5, Yong Liu1, and Dong Liu1、**
Author Affiliations
  • 1Anhui Institute of Optics and Fine Mechanics, Hefei Institutes of Physical Science, Chinese Academy of Sciences, Hefei 230031, Anhui, China
  • 2University of Science and Technology of China, Hefei 230026, Anhui, China
  • 3Anhui Branch of East China Air Traffic Administration of Civil Aviation of China, Hefei 230001, Anhui, China
  • 4Meteorological Observation Centre, China Meteorological Administration, Beijing 100081, China
  • 5Anhui University, Hefei 230039, Anhui, China
  • show less
    DOI: 10.3788/AOS220979 Cite this Article Set citation alerts
    Yiren Wang, Ming Yang, Daxin Liu, Yingwei Xia, Wanyi Xie, Hongkun Wang, Yong Liu, Dong Liu. Development and Data Analysis of Dual-Band All-Sky Cloud Cover Observation System[J]. Acta Optica Sinica, 2023, 43(6): 0612001 Copy Citation Text show less
    Structure diagram of dual-band automatic cloud cover observation system. (a) Schematic diagram; (b) physical picture
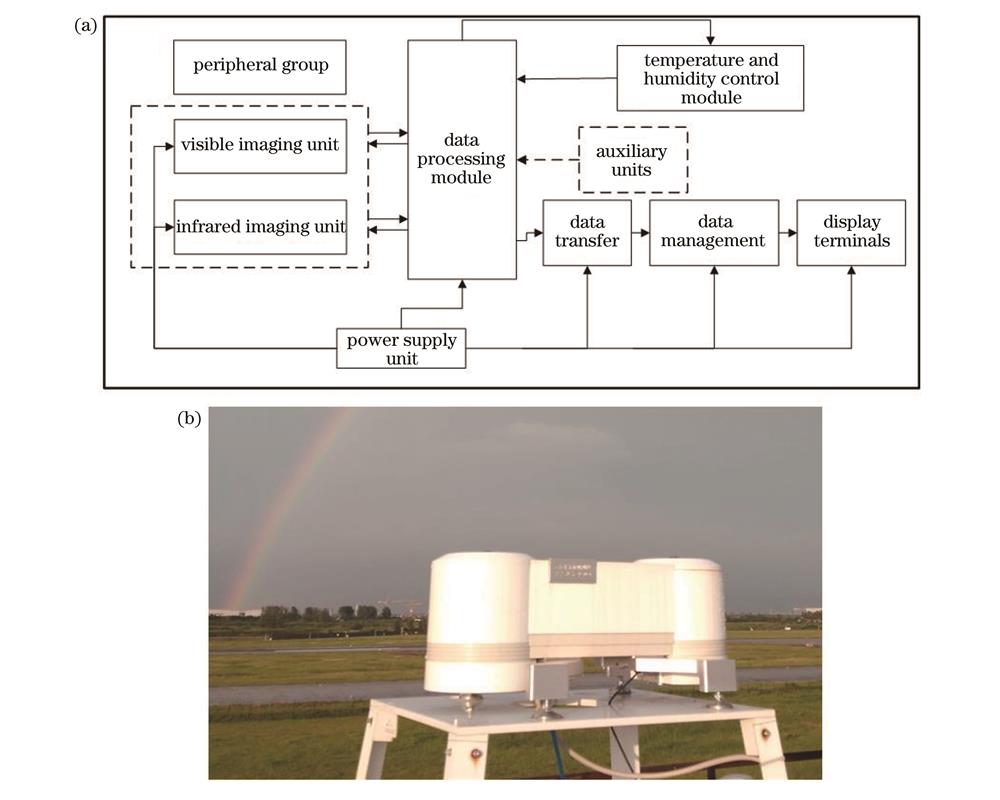
    Fig. 1. Structure diagram of dual-band automatic cloud cover observation system. (a) Schematic diagram; (b) physical picture
    All-sky cloud images. (a) Visible light band; (b) infrared band
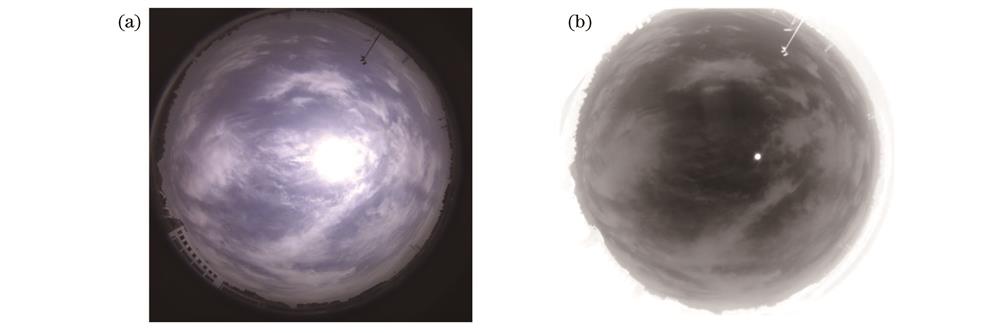
    Fig. 2. All-sky cloud images. (a) Visible light band; (b) infrared band
    Sky images with different exposure values. (a) Cloudy sky; (b) clear sky
    Fig. 3. Sky images with different exposure values. (a) Cloudy sky; (b) clear sky
    Atmospheric window characteristics
    Fig. 4. Atmospheric window characteristics
    SegCloud segmentation results of visible light cloud images
    Fig. 5. SegCloud segmentation results of visible light cloud images
    Clear sky background radiation simulation. (a) Parameter fitting; (b) background simulation result
    Fig. 6. Clear sky background radiation simulation. (a) Parameter fitting; (b) background simulation result
    Segmentation results of infrared cloud images
    Fig. 7. Segmentation results of infrared cloud images
    Correlation analysis of visible light and infrared cloud cover. (a) Data of August; (b) data of September; (c) data of October
    Fig. 8. Correlation analysis of visible light and infrared cloud cover. (a) Data of August; (b) data of September; (c) data of October
    Correlation analysis of observation results of different cloud types. (a) High cloud data; (b) middle cloud data; (c) low cloud data
    Fig. 9. Correlation analysis of observation results of different cloud types. (a) High cloud data; (b) middle cloud data; (c) low cloud data
    Statistical distributions of satellite cloud cover data and equipment data. (a) Data of August; (b) data of September; (c) data of October
    Fig. 10. Statistical distributions of satellite cloud cover data and equipment data. (a) Data of August; (b) data of September; (c) data of October
    TimeAugustSeptemberOctober
    Sample number103217901884
    R0.8850.8690.897
    Table 1. Correlation analysis of visible light and infrared cloud cover
    Cloud typeHigh cloudMiddle cloudLow cloud
    Sample number7189401412
    R0.670.730.84
    Table 2. Correlation analysis of observation results of different cloud types
    TimeAugustSeptemberOctober
    Sample number171297317
    Data percent for Vdiff1>218.13%17.51%9.46%
    Data percent for Vdiff2>214.04%19.53%11.99%
    Table 3. Comparison results of manual and equipment observation data
    TimeAugustSeptemberOctober
    Sample number171297315
    Data percent for Vdiff3>228.1%17.5%10.5%
    Data percent for Vdiff4>220.5%22.3%13.0%
    Table 4. Comparison of satellite data and equipment observation data
    Yiren Wang, Ming Yang, Daxin Liu, Yingwei Xia, Wanyi Xie, Hongkun Wang, Yong Liu, Dong Liu. Development and Data Analysis of Dual-Band All-Sky Cloud Cover Observation System[J]. Acta Optica Sinica, 2023, 43(6): 0612001
    Download Citation