
Zi-Hou He, Jing-Bo Zhao, Hong Yao, Xin Chen. Sound insulation performance of Helmholtz cavity with thin film bottom [J]. Acta Physica Sinica, 2019, 68(21): 214302-1
- Acta Physica Sinica
- Vol. 68, Issue 21, 214302-1 (2019)
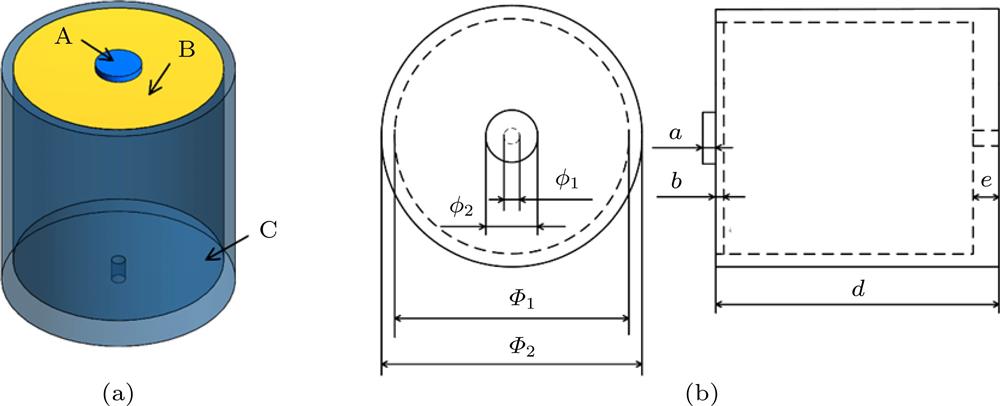
Fig. 1. Material structure: (a) Structural sketch; (b) structure parameter.材料结构 (a)结构示意图; (b)结构参数
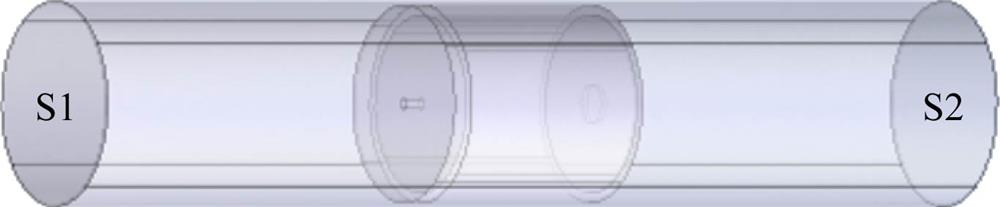
Fig. 2. Cavity structure.腔体结构
Fig. 3. Transmission loss curves.传输损失曲线
Fig. 4. Resonance mode (color bar represents the displacement values, unit: mm): (a) 69.44 Hz; (b) 325.40 Hz.共振模态(颜色条表示位移的取值, 单位为mm, 其余图同) (a) 69.44 Hz; (b) 325.40 Hz
Fig. 5. Resonance mode: (a) 25.05 Hz; (b) 68.53 Hz; (c) 420.72 Hz; (d) 622.76 Hz; (e) 944.71 Hz; (f) 1075.80 Hz.共振模态 (a) 25.05 Hz; (b) 68.53 Hz; (c) 420.72 Hz; (d) 622.76 Hz; (e) 944.71 Hz; (f) 1075.80 Hz
Fig. 6. Vibration mode diagrams at sound insulation peak: (a) 25.10 Hz; (b) 67.43 Hz; (c) 415.49 Hz; (d) 626.30 Hz; (e) 952.81 Hz; (f) 1080.08 Hz.隔声峰处振动模式图 (a) 25.10 Hz; (b) 67.43 Hz; (c) 415.49 Hz; (d) 626.30 Hz; (e) 952.81 Hz; (f) 1080.08 Hz
Fig. 7. Helmholtz cavity (a) and its equivalent circuit modelHelmholtz腔(a)及其等价电路模型(b)
Fig. 8. Helmholtz cavity with thin film bottom (a) and its equivalent circuit model.薄膜底面Helmholtz腔(a)及其等价电路模型(b)
Fig. 9. First resonance frequency.首阶共振频率
Fig. 10. Experimental schematic diagrams: (a), (b) Sample structure; (c) experimental facility.实验示意图 (a), (b)样件实物图; (c)实验装置
Fig. 11. Comparison between experimentally measured transmission loss curve and the results obtained by the finite element method.实验测得的传输损失曲线与数值计算结果的对比
Fig. 12. (a) Transmission coefficient; (b) reflection coefficient.(a)透射系数; (b)反射系数
Fig. 13. Effective parameters: (a) Effective mass density; (b) effective modulus.等效参数 (a)等效密度; (b)等效模量
Fig. 14. Structural sketch.结构示意图
Fig. 15. (a) Comparison of transmission loss between eccentric mass unit and central mass unit; (b) transmission loss curves when l is different.
(a)偏心质量单元与中心质量单元的传输损失曲线; (b)当 l 值不同时, 超材料的传输损失曲线
Fig. 16. Vibration mode: (a) 28.03 Hz; (b) 61.27 Hz; (c) 71.29 Hz; (d) 328.22 Hz; (e) 396.30 Hz; (f) 466.81 Hz.振动模式图 (a) 28.03 Hz; (b) 61.27 Hz; (c) 71.29 Hz; (d) 328.22 Hz; (e) 396.30 Hz; (f) 466.81 Hz
Fig. 17. Resonance modal diagram with the resonance frequency of 68.83 Hz when the mass unit is at the center.中心质量单元设计时, 68.83 Hz共振频率所对应共振模态图
Fig. 18. Experimental verification: (a) Sample structure; (b) transmission loss curves.实验验证 (a)样件图; (b)传输损失曲线
|
Table 1. Material parameters.

Set citation alerts for the article
Please enter your email address
© Copyright 2018-2021 | Chinese Laser Press. All Rights Reserved 沪ICP备15018463号-20