
Changlin Yan, Cong Wang, Linwei Zhou, Pengjie Guo, Kai Liu, Zhong-Yi Lu, Zhihai Cheng, Yang Chai, Anlian Pan, Wei Ji. Two ultra-stable novel allotropes of tellurium few-layers[J]. Chinese Physics B, 2020, 29(9):
- Chinese Physics B
- Vol. 29, Issue 9, (2020)
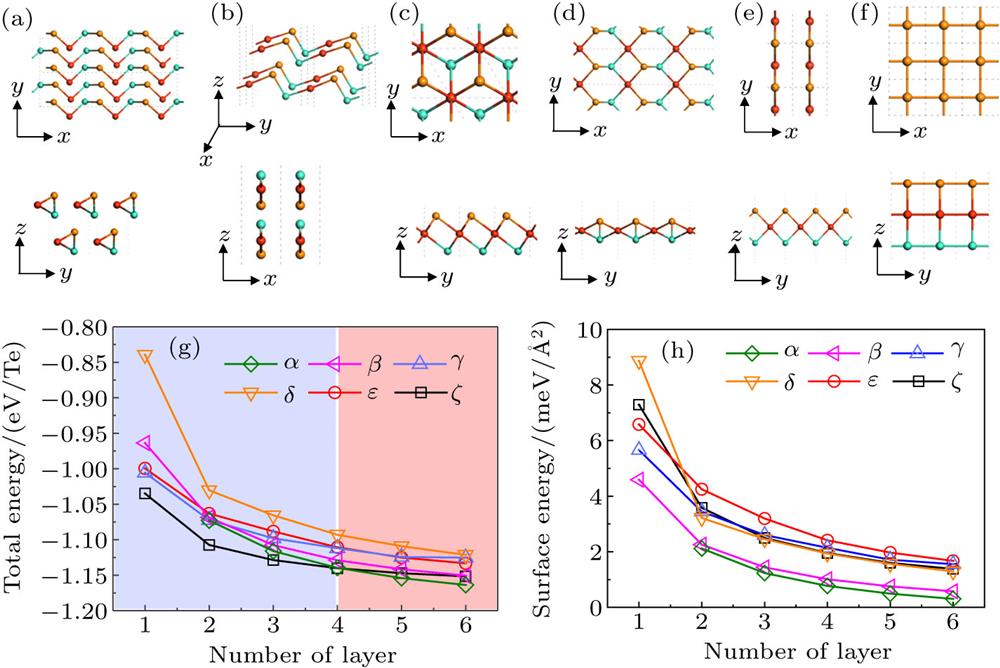
Fig. 1. (a) and (b) Top- and side-view of the bilayer α and δ phases, respectively. (c)–(f) Top- and side-views of monolayer Te in γ , β , ε , and ζ phases, respectively. Orange, red, and blue balls represent Te atoms in different sublayers along the interlayer direction z . (g)–(h) Total energies per Te atom and surface energies per unit area in different phases as a function of number of sublayers, respectively. The monolayer Te in α , γ , δ , ε , and ζ are presented with green, magenta, blue, orange, red, and black symbols, respectively.
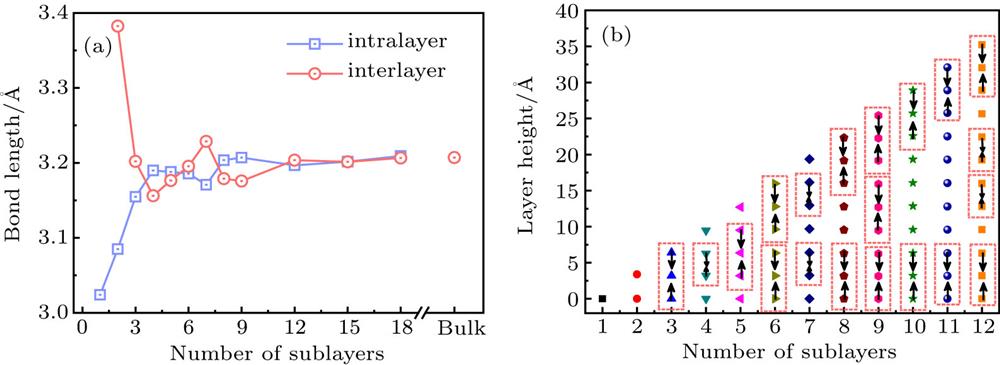
Fig. 2. Structure evolution of ζ Te after layer stacking. (a) Bond lengths as a function of the number of sublayers. The blue and red lines correspond to intra- and average interlayer Te–Te bond lengths, respectively. (b) The evolution of layer heights in ζ few-layer with respect to sublayer number. The layers marked in red dotted rectangular frame tend to form a dimer or trimer when stacking together.
Fig. 3. Topological properties of tri-sublayer ζ Te. (a) The orbital projection of the tri-sublayer ζ without SOC. (b) The band structure of the tri-sublayer ζ with SOC. Red dashed rectangles mark the location of the band inversion and band opening with the SOC effect. The four time-reversal invariant points are labeled as Γ , X , Y and S . (c) The parities of filled states of tri-sublayer ζ at four time-reversal-invariant points in the Brillouin zone. The “+” and “–” correspond to even and odd parity, respectively. (d) Edge states of the ribbon ζ . Red and blue lines represent the ribbon and bulk states, respectively.
Fig. 4. Phase diagram of Te under charge doping. Relative total energy of mono- (a), bi- (b), and four-layer (c) Te in different phases as a function of electron/hole doping level. The total energies of the ζ phase were chosen as the energy reference. Lines with different colors correspond to the relative energies of different phases: α , black; β , red; γ , blue; δ , dark cyan; ε , magenta; ζ , dark gray.


Set citation alerts for the article
Please enter your email address

© Copyright 2018-2021 | Chinese Laser Press. All Rights Reserved 沪ICP备15018463号-20