
Olivier Spitz, Jiagui Wu, Andreas Herdt, Grégory Maisons, Mathieu Carras, Wolfgang Elsäßer, Chee-Wei Wong, Frédéric Grillot, "Extreme events in quantum cascade lasers," Adv. Photon. 2, 066001 (2020)
- Advanced Photonics
- Vol. 2, Issue 6, 066001 (2020)
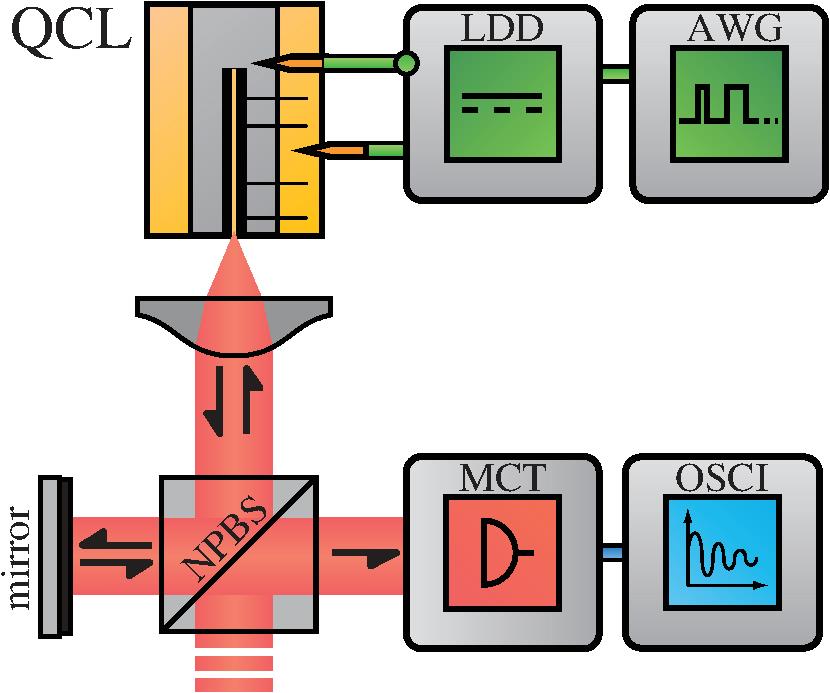
Fig. 1. Experimental setup with an external cavity for the OF via a mirror. NPBS, nonpolarizing beam splitter; MCT, mercury–cadmium–telluride detector; OSCI, fast oscilloscope; AWG, arbitrary waveform generator; LDD, laser diode driver.
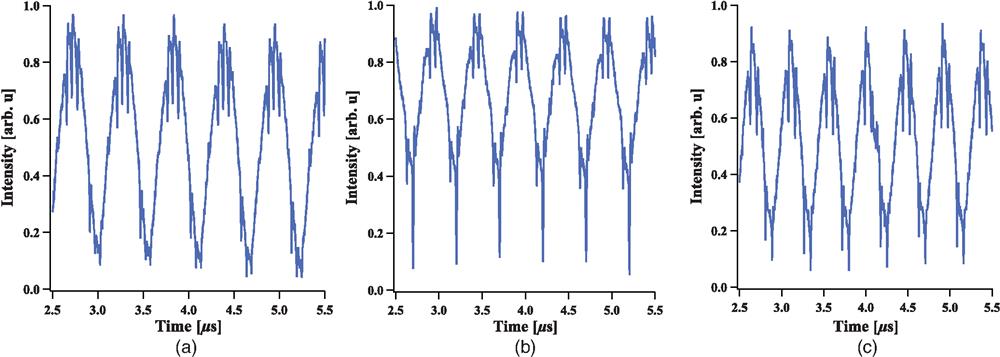
Fig. 2. Experimental time traces of the QCL output when external OF is applied to the QCL and with a sine modulation of the continuous bias of: (a) 1.8 MHz, (b) 2 MHz, and (c) 2.2 MHz; all of the traces were retrieved for a continuous bias of 430 mA and a modulation amplitude of 120 mA, but only the one in the middle exhibits dropouts with a magnified amplitude, which is, however, not enough to categorize them as extreme events.
Fig. 3. (a) Experimental time trace with extreme events and associated thresholds for the two criteria. The dashed red line represents the threshold corresponding to criterion
Fig. 4. Histogram of the retrieved maximal intensity and the related threshold for the Fig. 3 .
Fig. 5. (a) Time series centered on the maximum of local bursts and superposition of 37 extreme events. The corresponding averaged output power is displayed with a purple solid line and the threshold corresponding to an abnormality of 2 is displayed with a dash-dot line. (b) Same data plot but for 13 extreme events surging above an abnormality index of 2.4. In the left panel, the trough preceding the optical burst, as well as the oscillations following the extreme event, is underlined.
Fig. 6. (a) Experimental time traces of the QCL when OF and a sine wave modulation with a period of
Fig. 7. (a) Experimental time traces of the QCL when OF and an asymmetric square wave modulation with a period of
Fig. 8. (a) Histogram of the time intervals between extreme events in the case where Fig. 6 ; (b) histogram of the time intervals between extreme events in the case where Fig. 7 .
Fig. 9. (a) Time series centered on the maximum of local bursts and superposition of 17 extreme events in the case of the sine perturbation. The corresponding averaged output power is displayed with a purple solid line, and the threshold corresponding to an abnormality index of 2 is displayed with a dash-dot line. (b) Same data plot but for 48 extreme events in the case of the pulse-up perturbation. In the first case, the amplitude of the spikes is not constant, and they are all within a time window of


Set citation alerts for the article
Please enter your email address

© Copyright 2018-2021 | Chinese Laser Press. All Rights Reserved 沪ICP备15018463号-20