• Advanced Photonics
  • Vol. 2, Issue 3, 036006 (2020)
Lu Lan1, Yueming Li2, Tiffany Yang-Tran1, Ying Jiang1, Yingchun Cao3, and Ji-Xin Cheng1、3、4、*
Author Affiliations
  • 1Boston University, Department of Biomedical Engineering, Boston, Massachusetts, United States
  • 2Boston University, Department of Mechanical Engineering, Boston, Massachusetts, United States
  • 3Boston University, Department of Electrical and Computer Engineering, Boston, Massachusetts, United States
  • 4Boston University Photonics Center, Boston, Massachusetts, United States
  • show less
    DOI: 10.1117/1.AP.2.3.036006 Cite this Article Set citation alerts
    Lu Lan, Yueming Li, Tiffany Yang-Tran, Ying Jiang, Yingchun Cao, Ji-Xin Cheng. Ultraefficient thermoacoustic conversion through a split ring resonator[J]. Advanced Photonics, 2020, 2(3): 036006 Copy Citation Text show less
    Ultraefficient conversion of microwaves to ultrasound wave through the resonance effect in an SRR. (a) With a short microwave excitation pulse of its resonance frequency, the SRR confines the strong electric field at its gap and subsequently generates a transient thermal hotspot if any absorption by a nearby medium, which produces the ultrasound via TA effect. The inset shows an SRR made of copper as used in oil. (b) Simulated electric field intensity of the SRR used in oil on resonance. (c) Simulated electric field intensity at the gap (blue dotted line) and the pk2pk values of acoustic signal measured in experiments (red square line) over different excitation frequencies. (d) Normalized TA signal spectra of SRR bent from 0.2-mm diameter copper wire with lengths of 39 (red dots), 41 (green star), and 43 mm (blue square). The solid lines show their Gaussian fittings. (e) Comparison of the copper SRR (red) and two thin tubes filled with a solution of MWCNT plus saline (green) and DI water (blue). The signals from tubes are scaled 2000 times, whereas the copper SRR signal is not scaled.
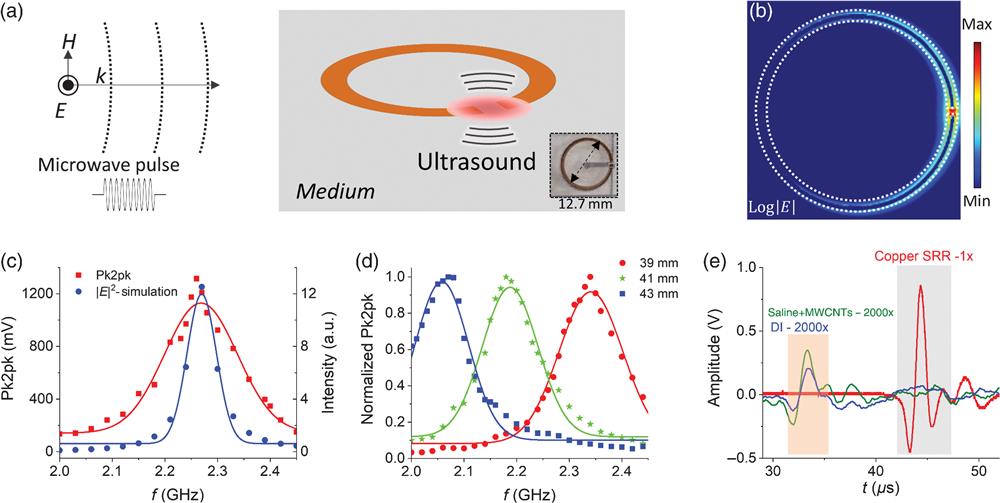
    Fig. 1. Ultraefficient conversion of microwaves to ultrasound wave through the resonance effect in an SRR. (a) With a short microwave excitation pulse of its resonance frequency, the SRR confines the strong electric field at its gap and subsequently generates a transient thermal hotspot if any absorption by a nearby medium, which produces the ultrasound via TA effect. The inset shows an SRR made of copper as used in oil. (b) Simulated electric field intensity of the SRR used in oil on resonance. (c) Simulated electric field intensity at the gap (blue dotted line) and the pk2pk values of acoustic signal measured in experiments (red square line) over different excitation frequencies. (d) Normalized TA signal spectra of SRR bent from 0.2-mm diameter copper wire with lengths of 39 (red dots), 41 (green star), and 43 mm (blue square). The solid lines show their Gaussian fittings. (e) Comparison of the copper SRR (red) and two thin tubes filled with a solution of MWCNT plus saline (green) and DI water (blue). The signals from tubes are scaled 2000 times, whereas the copper SRR signal is not scaled.
    Thermal imaging of the hotspot in the SRR with continuous microwave excitation at on-, near-, and off-resonance frequencies. (a) Visualize the microwave-thermal resonance effect by the SRR with a thermal paper inside a bulky oil medium. (b) Photo of the SRR mounted on a thermal paper. (c) Dark spots imprinted on thermal paper with different microwave excitation frequencies. (d)–(f) Thermal images of the SRR on an oil–air interface before microwave excitation at 2.49 GHz (on-resonance), 2.35 GHz (near-resonance), and 2.00 GHz (off-resonance) frequency, respectively. (g)–(i) Thermal images after 250-ms microwave excitation in (d)–(f) scenarios. (j) Temporal temperature plot at the gap of the SRR in on-, near-, and off-resonance scenarios. The inset shows the setup of thermal imaging measurement. Scale bar: 5 mm.
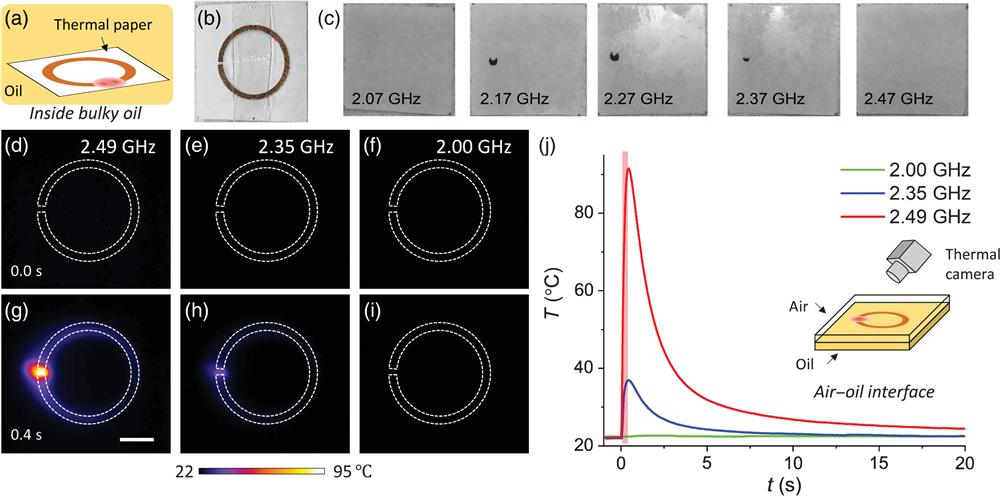
    Fig. 2. Thermal imaging of the hotspot in the SRR with continuous microwave excitation at on-, near-, and off-resonance frequencies. (a) Visualize the microwave-thermal resonance effect by the SRR with a thermal paper inside a bulky oil medium. (b) Photo of the SRR mounted on a thermal paper. (c) Dark spots imprinted on thermal paper with different microwave excitation frequencies. (d)–(f) Thermal images of the SRR on an oil–air interface before microwave excitation at 2.49 GHz (on-resonance), 2.35 GHz (near-resonance), and 2.00 GHz (off-resonance) frequency, respectively. (g)–(i) Thermal images after 250-ms microwave excitation in (d)–(f) scenarios. (j) Temporal temperature plot at the gap of the SRR in on-, near-, and off-resonance scenarios. The inset shows the setup of thermal imaging measurement. Scale bar: 5 mm.
    TA imaging of ultrasound wave generation from SRR. (a)–(c) US, TA, and merged images of the SRR in oil when UST array was placed above the SRR (configuration 1), as indicated by the top left image. (d) Cross-sectional TA images right above the ring gap in configuration 1. (e)–(g) US and TA merged images in 3-D presentation with 0, 4, and 8 μs delay between US detection and microwave excitation. (h) US images of SRR in configuration 2 as shown in bottom left image. (i) Corresponding TA image; (j) merged image of (h) and (i). Scale bar: 5 mm.
    Fig. 3. TA imaging of ultrasound wave generation from SRR. (a)–(c) US, TA, and merged images of the SRR in oil when UST array was placed above the SRR (configuration 1), as indicated by the top left image. (d) Cross-sectional TA images right above the ring gap in configuration 1. (e)–(g) US and TA merged images in 3-D presentation with 0, 4, and 8  μs delay between US detection and microwave excitation. (h) US images of SRR in configuration 2 as shown in bottom left image. (i) Corresponding TA image; (j) merged image of (h) and (i). Scale bar: 5 mm.
    Multiplexed acoustic emission of arbitrary frequencies by PWM on the microwave. (a) Measurement setup. The inset shows a schematic of the PWM on the microwave excitation pulses. (b) Measured TA signals (left) and their RF spectra (right) after Fourier transformation using PWM with T=0.4, 1.0, and 1.2 μs, respectively. (c) Peak frequencies in acoustic emission using PWM of different pulse periods T (black square dots) and the theoretical values determined by 1/T (red solid line). (d), (e) PWM signals with two arbitrary tone frequencies at 0.63 and 1.67 MHz applied, their corresponding TA signals and RF spectra, respectively (from left to right). (f) Result of frequency multiplex of PWM in (d) and (e). (g) Result of a temporal multiplex of two arbitrary frequencies at 0.55 and 1.30 MHz. (h) Result with a reverse temporal sequence in (g).
    Fig. 4. Multiplexed acoustic emission of arbitrary frequencies by PWM on the microwave. (a) Measurement setup. The inset shows a schematic of the PWM on the microwave excitation pulses. (b) Measured TA signals (left) and their RF spectra (right) after Fourier transformation using PWM with T=0.4, 1.0, and 1.2  μs, respectively. (c) Peak frequencies in acoustic emission using PWM of different pulse periods T (black square dots) and the theoretical values determined by 1/T (red solid line). (d), (e) PWM signals with two arbitrary tone frequencies at 0.63 and 1.67 MHz applied, their corresponding TA signals and RF spectra, respectively (from left to right). (f) Result of frequency multiplex of PWM in (d) and (e). (g) Result of a temporal multiplex of two arbitrary frequencies at 0.55 and 1.30 MHz. (h) Result with a reverse temporal sequence in (g).
    Proof-of-concept demonstration of the SRR as a wireless, battery-free, US emitter. (a) The SRR was packaged in a thin plastic bag with small volume of oil and placed under a breast biopsy US training model. (b) Measured acoustic signal at the top of the breast biopsy phantom. (c) The pk2pk values of the measured acoustic signal when the waveguide was moved at different distances away from the phantom. (d) and (e) The acoustic signal measured before and after a card box or a box full of rubber gloves was inserted between the waveguide and phantom, respectively.
    Fig. 5. Proof-of-concept demonstration of the SRR as a wireless, battery-free, US emitter. (a) The SRR was packaged in a thin plastic bag with small volume of oil and placed under a breast biopsy US training model. (b) Measured acoustic signal at the top of the breast biopsy phantom. (c) The pk2pk values of the measured acoustic signal when the waveguide was moved at different distances away from the phantom. (d) and (e) The acoustic signal measured before and after a card box or a box full of rubber gloves was inserted between the waveguide and phantom, respectively.
    Lu Lan, Yueming Li, Tiffany Yang-Tran, Ying Jiang, Yingchun Cao, Ji-Xin Cheng. Ultraefficient thermoacoustic conversion through a split ring resonator[J]. Advanced Photonics, 2020, 2(3): 036006
    Download Citation