• Chinese Journal of Lasers
  • Vol. 49, Issue 20, 2007209 (2022)
Yakun Liu1, Wen Xiao1, Leiping Che1, Yinjia Li3, Xi Xiao2, Hao Wang2, and Feng Pan1、*
Author Affiliations
  • 1Key Laboratory of Precision Opto-Mechatronics Technology, School of Instrumentation & Optoelectronic Engineering, Beihang University, Beijing 100191, China
  • 2Department of Radiation Oncology, Peking University Third Hospital, Beijing 100191, China
  • 3Medical Research Center, Peking University Third Hospital, Beijing 100191, China
  • show less
    DOI: 10.3788/CJL202249.2007209 Cite this Article Set citation alerts
    Yakun Liu, Wen Xiao, Leiping Che, Yinjia Li, Xi Xiao, Hao Wang, Feng Pan. Cancer Cell Vacuolization Imaging Based on Digital Holographic Microscopy Tomography[J]. Chinese Journal of Lasers, 2022, 49(20): 2007209 Copy Citation Text show less
    Schematic of digital holographic microscopy tomography optical path
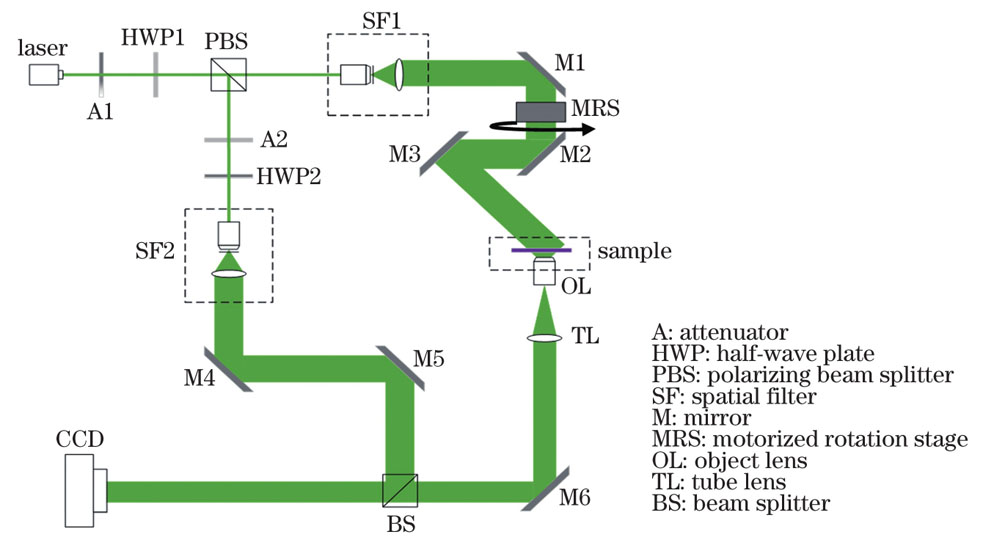
    Fig. 1. Schematic of digital holographic microscopy tomography optical path
    Phase images of SiO2 microsphere at different angles. (a) 90°;(b) 180°;(c) 0°
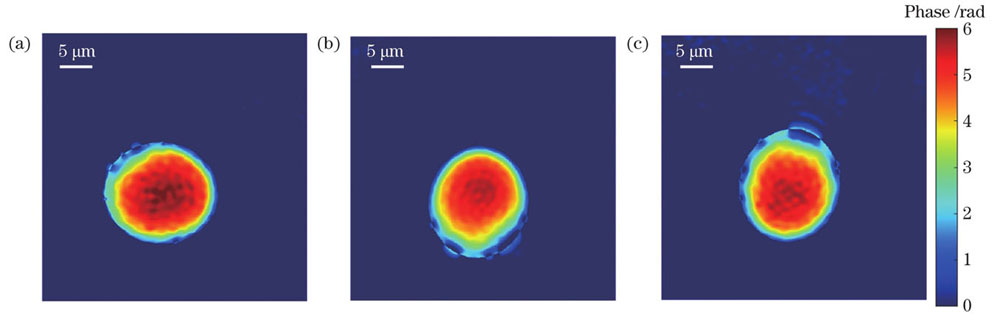
    Fig. 2. Phase images of SiO2 microsphere at different angles. (a) 90°;(b) 180°;(c) 0°
    Three-dimensional tomographic reconstruction results of SiO2 microsphere. (a) Central slice in x-y plane; (b) central slice in x-z plane; (c) central slice in y-z plane; (d) three-dimensional tomographic reconstruction result of SiO2 microsphere
    Fig. 3. Three-dimensional tomographic reconstruction results of SiO2 microsphere. (a) Central slice in x-y plane; (b) central slice in x-z plane; (c) central slice in y-z plane; (d) three-dimensional tomographic reconstruction result of SiO2 microsphere
    Holograms at different angles and at the same position and their corresponding spectra, where the area inside the circle is selected filtering window. (a)(d) 90°;(b)(e) 180°;(c)(f) 0°
    Fig. 4. Holograms at different angles and at the same position and their corresponding spectra, where the area inside the circle is selected filtering window. (a)(d) 90°;(b)(e) 180°;(c)(f) 0°
    Variation of focusing criterion with focusing distance and corresponding amplitude images of different focusing distances, where rectangle represents the selected focus window. (a) Variation of focusing criterion with focusing distance, focusing distance corresponding to the lowest point of the curve is the best reconstruction distance; (b)-(d) reconstruction amplitude images, focusing distance is -3.00, -1.51, and 0 cm, respectively
    Fig. 5. Variation of focusing criterion with focusing distance and corresponding amplitude images of different focusing distances, where rectangle represents the selected focus window. (a) Variation of focusing criterion with focusing distance, focusing distance corresponding to the lowest point of the curve is the best reconstruction distance; (b)-(d) reconstruction amplitude images, focusing distance is -3.00, -1.51, and 0 cm, respectively
    Cell phase images before and after phase unwrapping. (a) Cell phase image before phase unwrapping; (b) cell phase image after unwrapping
    Fig. 6. Cell phase images before and after phase unwrapping. (a) Cell phase image before phase unwrapping; (b) cell phase image after unwrapping
    Phase images of bladder cancer cells with vacuoles, phase distribution along the dotted line of phase images, and three-dimensional display results of phase images. (a) Cell 1; (b) cell 2; (c) cell 3; (d) cell 4
    Fig. 7. Phase images of bladder cancer cells with vacuoles, phase distribution along the dotted line of phase images, and three-dimensional display results of phase images. (a) Cell 1; (b) cell 2; (c) cell 3; (d) cell 4
    Three-dimensional tomographic reconstruction results of bladder cancer cells with vacuoles. (a) Cell 1; (b) cell 2;(c) cell 3; (d) cell 4
    Fig. 8. Three-dimensional tomographic reconstruction results of bladder cancer cells with vacuoles. (a) Cell 1; (b) cell 2;(c) cell 3; (d) cell 4
    CellVolume of vacuole /(102μm3)Surface area of vacuole /(102μm2)Ratio of surface area to volume /μm-1Ratio of vacuole volume to cell volume
    Cell 12.332.310.9910.113
    Cell 22.802.270.8110.267
    Cell 32.031.360.6700.060
    Cell 40.150.322.1330.009
    Table 1. Three-dimensional morphological parameters of each cell
    Yakun Liu, Wen Xiao, Leiping Che, Yinjia Li, Xi Xiao, Hao Wang, Feng Pan. Cancer Cell Vacuolization Imaging Based on Digital Holographic Microscopy Tomography[J]. Chinese Journal of Lasers, 2022, 49(20): 2007209
    Download Citation