• Laser & Optoelectronics Progress
  • Vol. 57, Issue 5, 050801 (2020)
Zirun Li, Baoqing Lin, Qing Lin, Feifei Gao, Yong He, and Qiren Zhuang*
Author Affiliations
  • Fujian Provincial Key Laboratory of Light Propagation and Transformation, College of Information Science and Engineering, Huaqiao University, Xiamen, Fujian 361021, China
  • show less
    DOI: 10.3788/LOP57.050801 Cite this Article Set citation alerts
    Zirun Li, Baoqing Lin, Qing Lin, Feifei Gao, Yong He, Qiren Zhuang. Preparation of Backlight Plate with Plastic Fiber Array by Blade Carving V-Groove Method[J]. Laser & Optoelectronics Progress, 2020, 57(5): 050801 Copy Citation Text show less
    Diagrams of fabricating V-groove for scattering point backlight plate of plastic optical fiber array. (a) Fabricating V-groove to form plastic fiber scattering point; (b) backlight plate of plastic fiber optic array
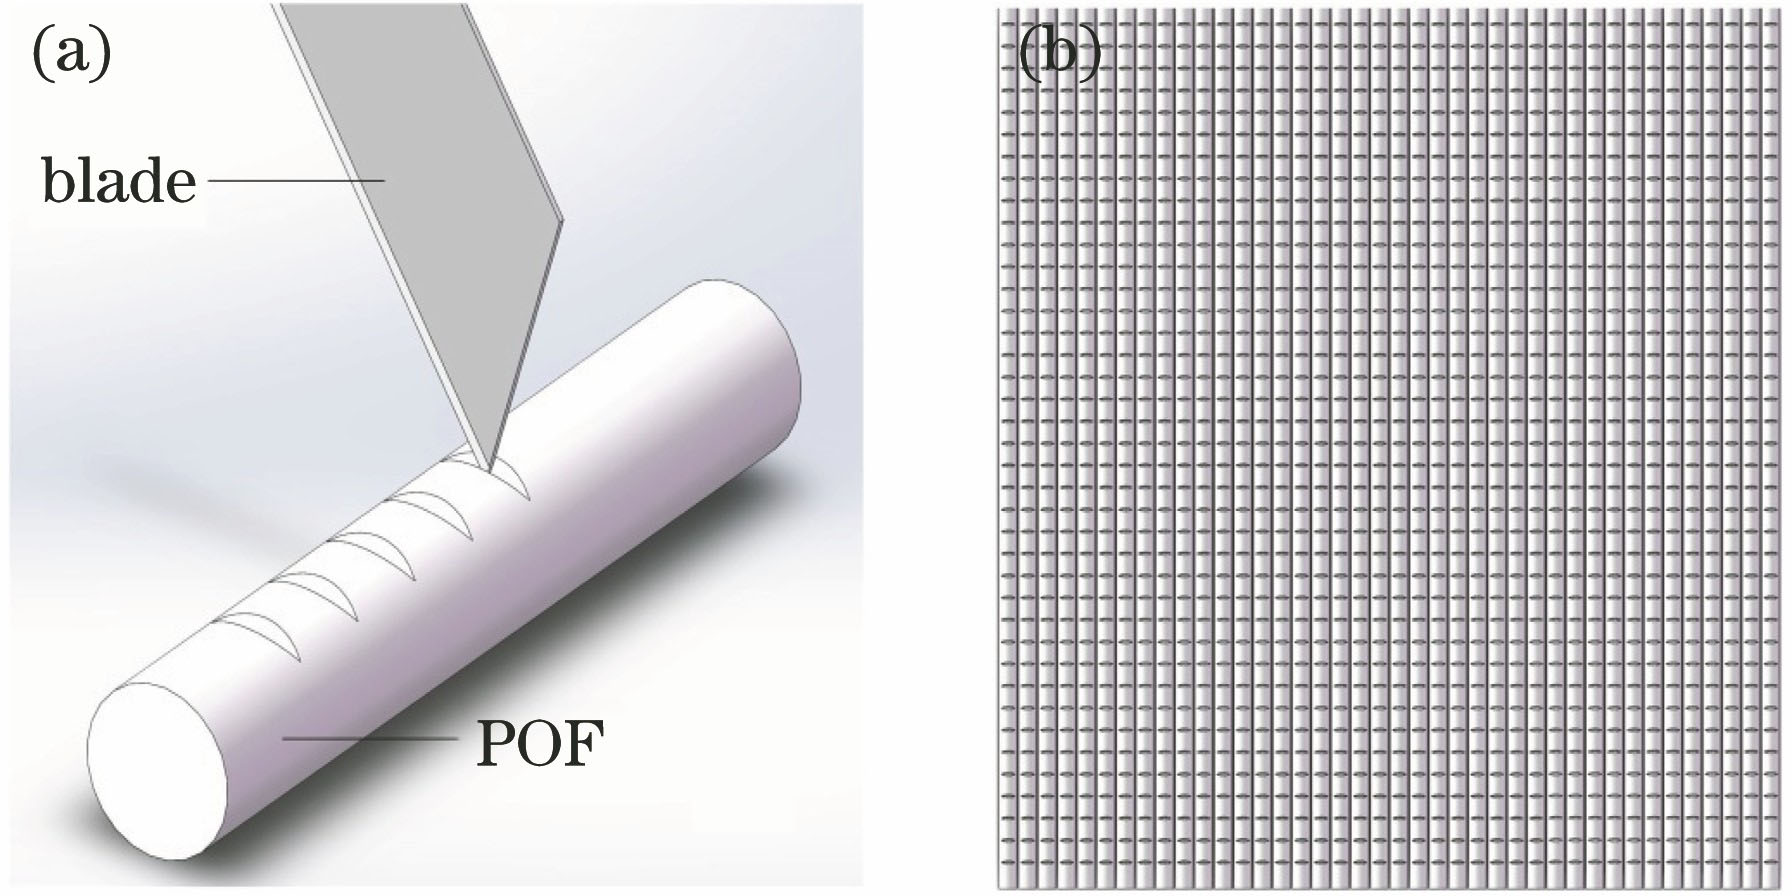
    Fig. 1. Diagrams of fabricating V-groove for scattering point backlight plate of plastic optical fiber array. (a) Fabricating V-groove to form plastic fiber scattering point; (b) backlight plate of plastic fiber optic array
    Diagram of light passing through scattering point
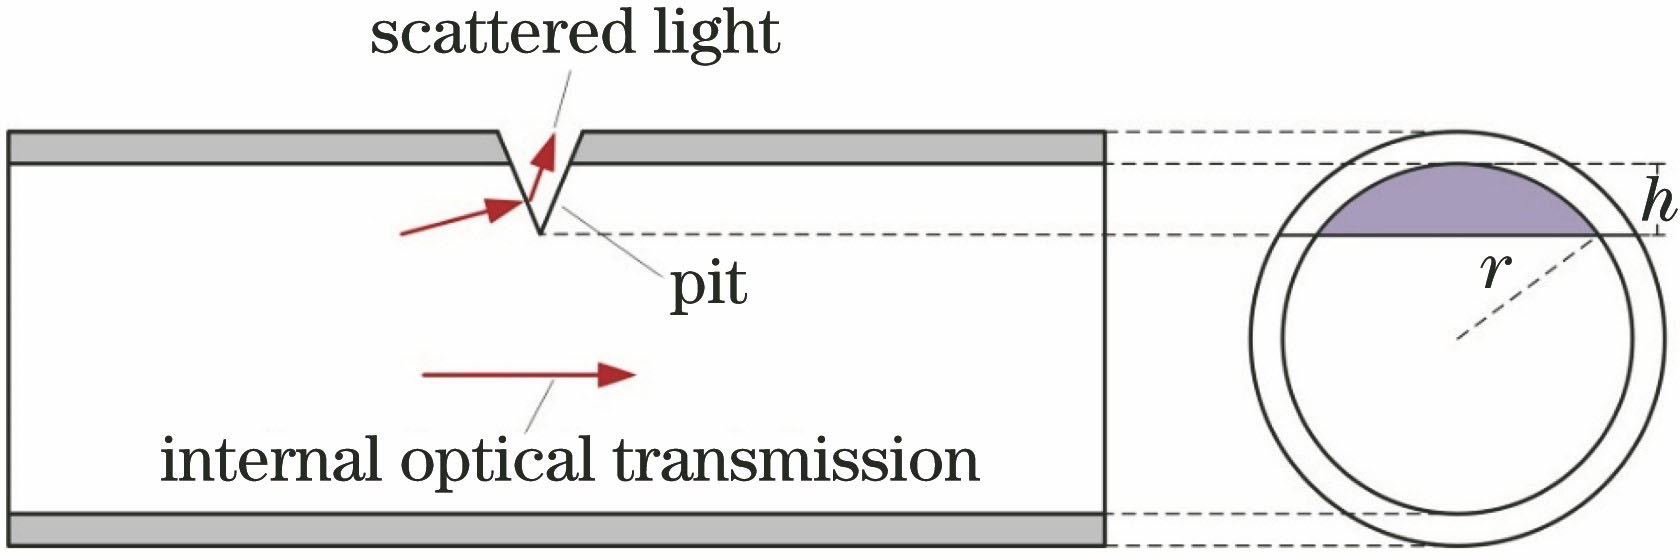
    Fig. 2. Diagram of light passing through scattering point
    Design schematic of isometric scattering points on the side of POF
    Fig. 3. Design schematic of isometric scattering points on the side of POF
    Diagram of V-groove processing
    Fig. 4. Diagram of V-groove processing
    Testing setup diagram of scattering light power of scattering points of POF
    Fig. 5. Testing setup diagram of scattering light power of scattering points of POF
    Relationship among scattering rate, weight mass, and scattering point number. (a) Relationship between scattering rate and weight mass; (b) relationship between weight mass Mi and scattering point number i
    Fig. 6. Relationship among scattering rate, weight mass, and scattering point number. (a) Relationship between scattering rate and weight mass; (b) relationship between weight mass Mi and scattering point number i
    Diagram of knife head assembly of POF processing device
    Fig. 7. Diagram of knife head assembly of POF processing device
    Diagram of processing equipment for isometric scattering point of POF array
    Fig. 8. Diagram of processing equipment for isometric scattering point of POF array
    Microscopic photographs of scattering point on POF side. (a) Front view of scattering point without light; (b) front view of scattering point with light; (c) side view of scattering point
    Fig. 9. Microscopic photographs of scattering point on POF side. (a) Front view of scattering point without light; (b) front view of scattering point with light; (c) side view of scattering point
    Photos of scattered points of plastic fiber under different weight mass. (a) M=6 g; (b) M=12 g; (c) M=18 g; (d) M=24 g; (e) M=30 g; (f) M=36 g; (g) M=42 g; (h) M=48 g; (i) M=54 g
    Fig. 10. Photos of scattered points of plastic fiber under different weight mass. (a) M=6 g; (b) M=12 g; (c) M=18 g; (d) M=24 g; (e) M=30 g; (f) M=36 g; (g) M=42 g; (h) M=48 g; (i) M=54 g
    Effect pictures of isometric scattering points of single plastic fiber. (a) Morphology of scattered points; (b) effect of scattering light at scattering point; (c) light intensity distribution curve
    Fig. 11. Effect pictures of isometric scattering points of single plastic fiber. (a) Morphology of scattered points; (b) effect of scattering light at scattering point; (c) light intensity distribution curve
    Photograph of POF array backlight plate with isometric scattering point fabricated in experiment
    Fig. 12. Photograph of POF array backlight plate with isometric scattering point fabricated in experiment
    System for measuring luminance uniformity on side of backlight plate of POF array with isometric scattering points. (a) Picture of detection device; (b) detection device of luminance meter; (c) nine-point sampling position map
    Fig. 13. System for measuring luminance uniformity on side of backlight plate of POF array with isometric scattering points. (a) Picture of detection device; (b) detection device of luminance meter; (c) nine-point sampling position map
    Core materialCladdingmaterialCorerefractive indexRefractiveindex profileNumericalapertureCorediameter /μmCladdingdiameter /μm
    Polymetyl-Methacrylate ResinFluorinatedPolymer1.496Step index0.5486500
    Table 1. Parameters and materials of SK-20 polymer optical fiber used in experiment
    Brightnessrange / (103 cd·m-2)Brightnessaccuracy /%Brightnessrepeatability /%Integrationtime /msFocal lengthof lens / mmField ofview of lens
    1×10⁻⁵-151500-150000±5±15-10000569.1°(horizontal)×6.7°(vertical)
    Table 2. Performance parameters of CX-2B imaging luminance meter used in experiment
    No.Measurement result /(cd·m-2)
    Q1Q2Q3Q4Q5Q6Q7Q8Q9
    123475.2482.5469.8526.3511.1510.0546.9534.5544.5499.1491.6504.5540.1543.1525.1532.4552.4546.6543.2532.9536.8562.5553.3559.8555.5549.3552.1
    Average475.8515.8542.0498.4536.1543.8537.6558.5552.3
    Table 3. Measurement results of nine-point method for luminance uniformity of side-glowing POF surface light source
    No.Measurement result /(cd·m-2)
    Q1Q2Q3Q4Q5Q6Q7Q8Q9
    123529.6538.8533.9524.3519.4527.1551.7562.3557.6559.4552.3553.6543.1538.6545.5561.3554.5566.6575.2561.3568.1564.2561.1549.9586.5567.8574.3
    Average534.1523.6557.6555.1542.4560.8568.558.4576.2
    Table 4. Measurement results of nine-point method for luminance uniformity of side-glowing POF surface light source with optimized processing
    Zirun Li, Baoqing Lin, Qing Lin, Feifei Gao, Yong He, Qiren Zhuang. Preparation of Backlight Plate with Plastic Fiber Array by Blade Carving V-Groove Method[J]. Laser & Optoelectronics Progress, 2020, 57(5): 050801
    Download Citation