• Photonics Research
  • Vol. 6, Issue 3, 182 (2018)
Pengfei Zhang1、3、*, Gang Song1、2、*, and Li Yu1
Author Affiliations
  • 1School of Science, Beijing University of Posts and Telecommunications, Beijing 100876, China
  • 2e-mail: songgangbupt@163.com
  • 3e-mail: pfzhang1980@gmail.com
  • show less
    DOI: 10.1364/PRJ.6.000182 Cite this Article Set citation alerts
    Pengfei Zhang, Gang Song, Li Yu. Optical trapping of single quantum dots for cavity quantum electrodynamics[J]. Photonics Research, 2018, 6(3): 182 Copy Citation Text show less
    Optical trapping of quantum dots for the study of the strong light–matter interaction. (a) Nanotweezers with double holes in a silver patch. (b) Scattering spectrum of the nano-structure without quantum dots. The spectrum is normalized to its maximum. (c) Electric field distribution in the x–y plane located at the top surface of the silver patch. (d) Electric field distribution in the x–z plane bisecting the nanostructure. Gray areas indicate the structures.
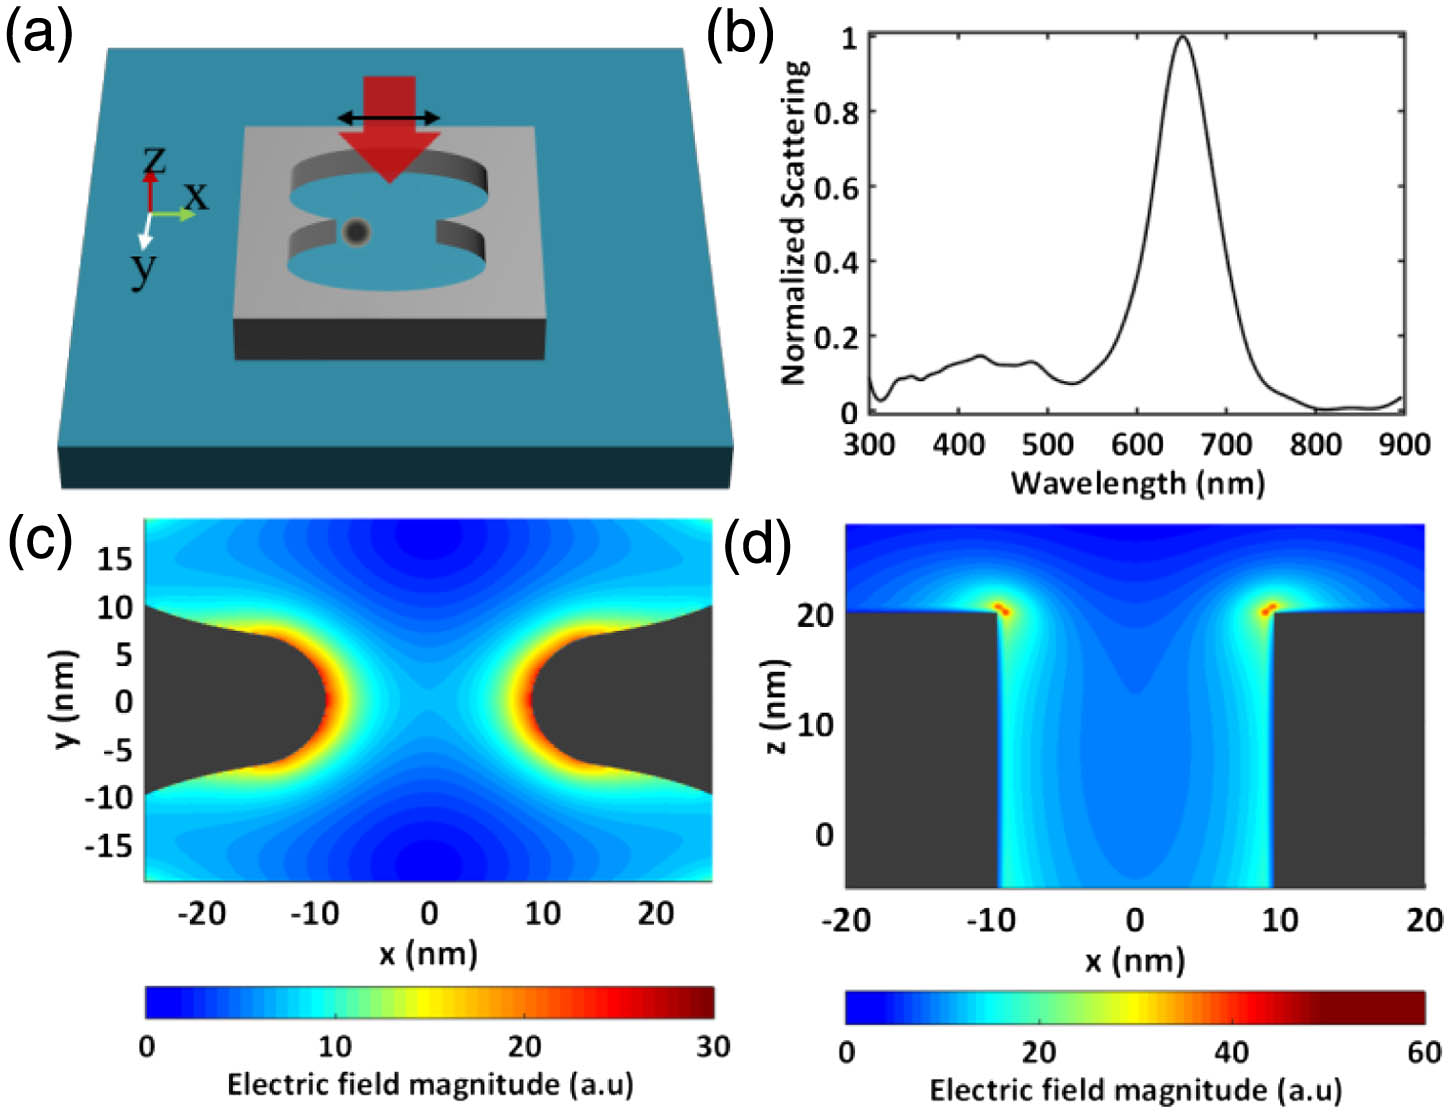
    Fig. 1. Optical trapping of quantum dots for the study of the strong light–matter interaction. (a) Nanotweezers with double holes in a silver patch. (b) Scattering spectrum of the nano-structure without quantum dots. The spectrum is normalized to its maximum. (c) Electric field distribution in the xy plane located at the top surface of the silver patch. (d) Electric field distribution in the xz plane bisecting the nanostructure. Gray areas indicate the structures.
    Optical force generated by the localized surface electromagnetic field. (a) Electrical field distribution of the nanocavity in the x–z plane bisecting the structure when a quantum dot is present at one of the tips. (b) Optical force on the quantum dot as a function of trapping laser wavelength. (c) Optical force vector field in the x–y plane located at the top surface of the silver patch. (d) Optical force vector field in the x–z plane bisecting the structure.
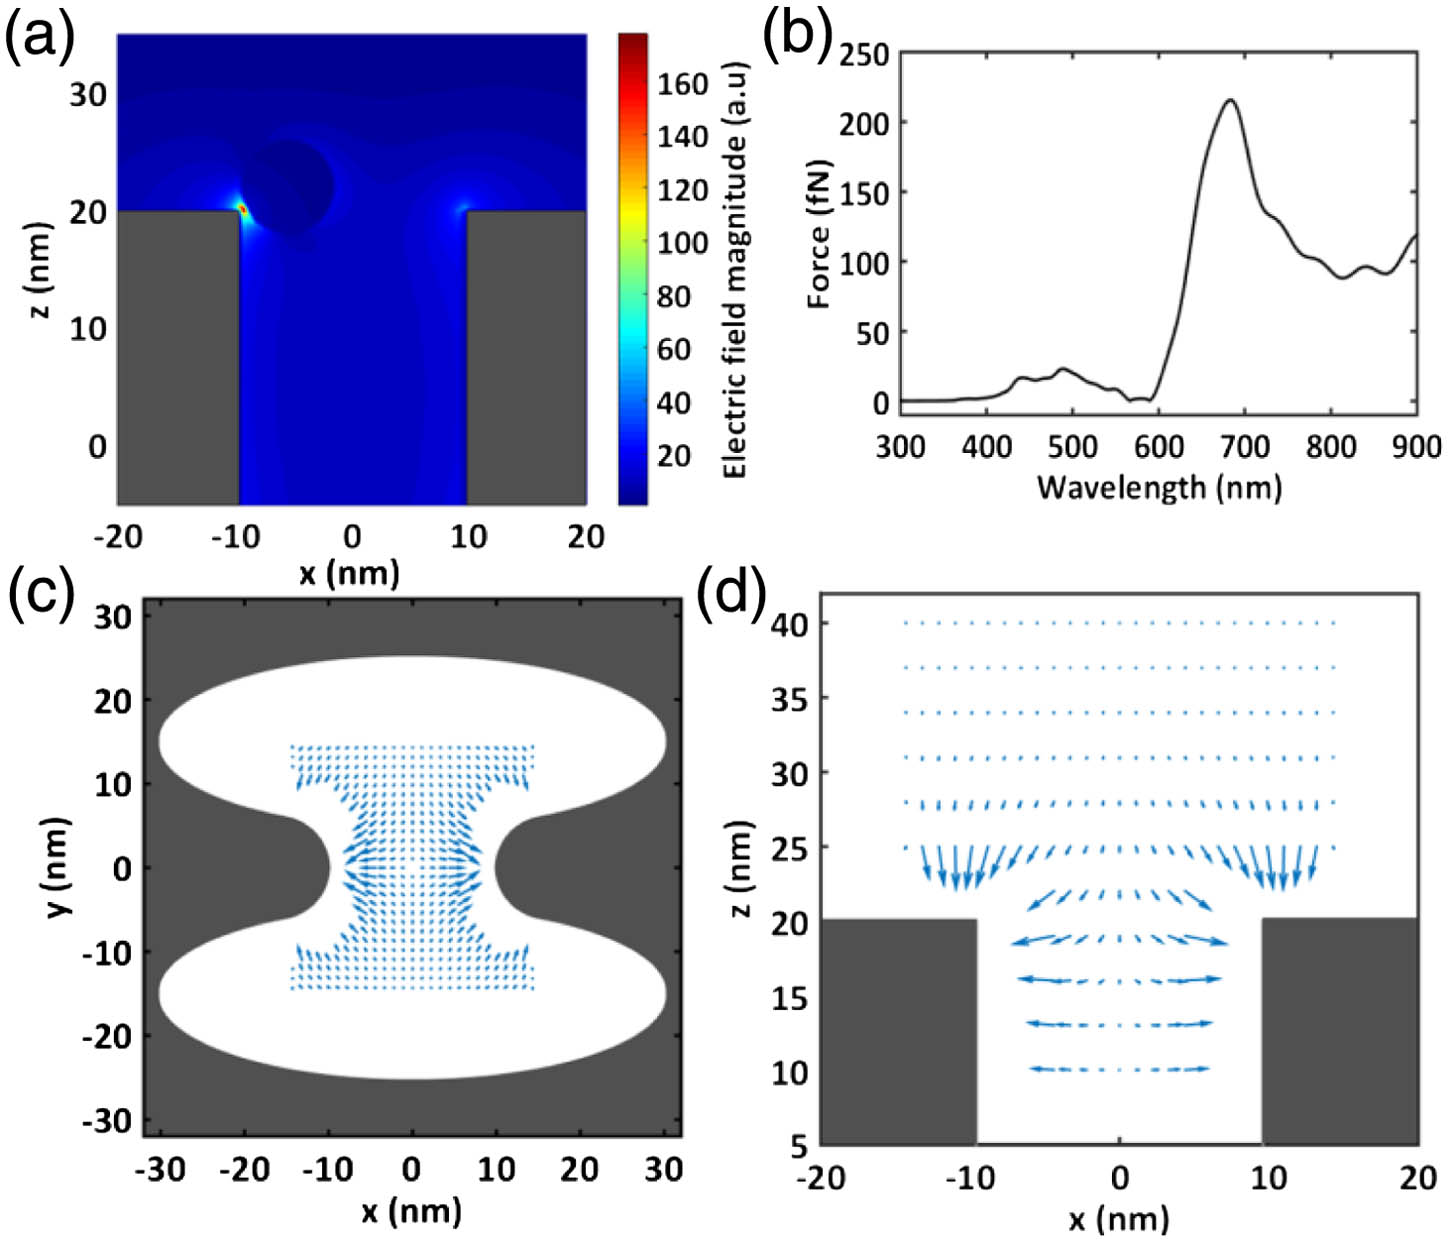
    Fig. 2. Optical force generated by the localized surface electromagnetic field. (a) Electrical field distribution of the nanocavity in the xz plane bisecting the structure when a quantum dot is present at one of the tips. (b) Optical force on the quantum dot as a function of trapping laser wavelength. (c) Optical force vector field in the xy plane located at the top surface of the silver patch. (d) Optical force vector field in the xz plane bisecting the structure.
    Optical force on a quantum dot located at different positions in the cavity. (a) X component of the optical force as a function of the x coordinates of the quantum dot. The y and z coordinates of the quantum dot are fixed at 0 and 19 nm, respectively. (b) Z component of the optical force as a function of the z coordinates of the quantum dot. The x and y coordinates of the quantum dot are fixed at 4.4 and 0 nm, respectively. The solid curves are calculated from the Maxwell’s stress tensor, and the dashed lines are calculated from the electric field intensity gradient of the bare cavity. The intensity of the trapping laser used in the simulation is 1 mW/μm2. The dashed curves are magnified by a magnitude of five orders for display. MST, Maxwell’s stress tensor method; gradient, field intensity gradient method.
    Fig. 3. Optical force on a quantum dot located at different positions in the cavity. (a) X component of the optical force as a function of the x coordinates of the quantum dot. The y and z coordinates of the quantum dot are fixed at 0 and 19 nm, respectively. (b) Z component of the optical force as a function of the z coordinates of the quantum dot. The x and y coordinates of the quantum dot are fixed at 4.4 and 0 nm, respectively. The solid curves are calculated from the Maxwell’s stress tensor, and the dashed lines are calculated from the electric field intensity gradient of the bare cavity. The intensity of the trapping laser used in the simulation is 1  mW/μm2. The dashed curves are magnified by a magnitude of five orders for display. MST, Maxwell’s stress tensor method; gradient, field intensity gradient method.
    Scattering spectra of the nanocavity and the trapped quantum dots. (a) Scattering spectrum of the nanotweezers with two quantum dots trapped at the edges of the cavity’s tips. Quantum dots are resonant with the nanocavity. (b) Scattering spectra of the nanotweezers with two trapped quantum dots having various emissions. Spectra are ordered by the detuning energy of the quantum dots from the plasmonic cavity.
    Fig. 4. Scattering spectra of the nanocavity and the trapped quantum dots. (a) Scattering spectrum of the nanotweezers with two quantum dots trapped at the edges of the cavity’s tips. Quantum dots are resonant with the nanocavity. (b) Scattering spectra of the nanotweezers with two trapped quantum dots having various emissions. Spectra are ordered by the detuning energy of the quantum dots from the plasmonic cavity.
    Pengfei Zhang, Gang Song, Li Yu. Optical trapping of single quantum dots for cavity quantum electrodynamics[J]. Photonics Research, 2018, 6(3): 182
    Download Citation