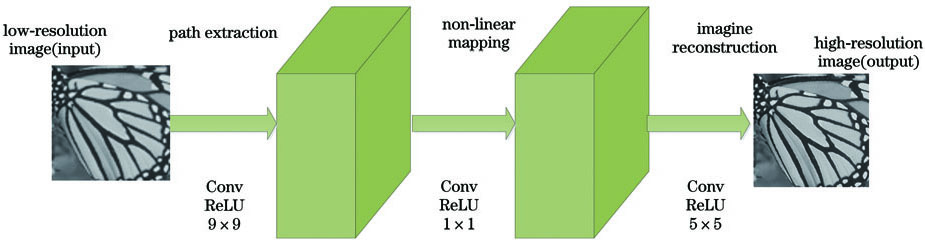
Fig. 1. Overall structure of the SRCNN
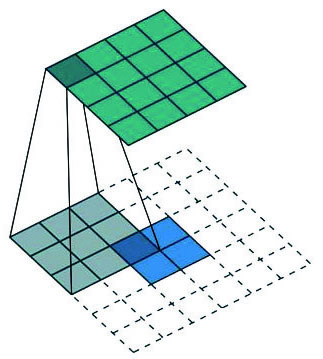
Fig. 2. Structure of the deconvolution
Fig. 3. Improved SRCNN structure
Fig. 4. Residual network
Fig. 5. Improved residual network
Fig. 6. Reconstruction effects of different algorithms. (a) Bicubic; (b) SRCNN; (c) FSRCNN; (d) our algorithm
Fig. 7. Reconstruction effect of the actual acquired image. (a) Low-resolution images; (b) our algorithm; (c) high-resolution images
Algorithm | Baby | Bird | Butterfly | Head | Woman |
---|
Bicubic | 27.28 | 35.31 | 247.33 | 34.75 | 93.45 | SRCNN | 21.97 | 23.78 | 134.33 | 30.86 | 65.77 | FSRCNN | 22.41 | 23.60 | 127.43 | 30.53 | 62.93 | RD-SRCNN | 21.09 | 17.69 | 86.44 | 28.79 | 49.95 |
|
Table 1. MSE of different algorithms
Algorithm | Baby | Bird | Butterfly | Head | Woman |
---|
Bicubic | 0.90 | 0.92 | 0.82 | 0.80 | 0.88 | SRCNN | 0.91 | 0.94 | 0.87 | 0.81 | 0.91 | FSRCNN | 0.91 | 0.95 | 0.88 | 0.82 | 0.91 | RD-SRCNN | 0.92 | 0.96 | 0.92 | 0.83 | 0.93 |
|
Table 2. SSIM of different algorithms
Algorithm | Baby | Bird | Butterfly | Head | Woman |
---|
Bicubic | 33.77 | 32.65 | 24.19 | 32.72 | 28.42 | SRCNN | 34.71 | 34.21 | 26.54 | 33.23 | 29.95 | FSRCNN | 34.72 | 34.40 | 27.07 | 33.28 | 30.14 | RD-SRCNN | 34.88 | 35.65 | 28.76 | 33.54 | 31.15 |
|
Table 3. Reconstruction effects of different algorithms unit: dB
Evaluation indicator | Activation function | Baby | Bird | Butterfly | Head | Woman |
---|
MSE | ELU | 21.31 | 23.12 | 123.51 | 30.29 | 58.82 | ReLU | 22.41 | 23.60 | 127.43 | 30.53 | 62.93 | SSIM | ELU | 0.91 | 0.94 | 0.89 | 0.82 | 0.92 | ReLU | 0.91 | 0.94 | 0.88 | 0.81 | 0.91 | PSNR /dB | ELU | 34.84 | 34.49 | 27.21 | 33.32 | 30.43 | ReLU | 34.62 | 34.40 | 27.07 | 33.28 | 30.14 |
|
Table 4. Comparison of different activation functions in the 5-layer network structure
Evaluation indicator | Activation function | Baby | Bird | Butterfly | Head | Woman |
---|
MSE | ELU | 21.23 | 21.18 | 106.74 | 29.27 | 56.26 | ReLU | 22.33 | 21.86 | 113.67 | 29.80 | 56.43 | SSIM | ELU | 0.92 | 0.95 | 0.90 | 0.83 | 0.92 | ReLU | 0.91 | 0.94 | 0.89 | 0.82 | 0.92 | PSNR /dB | ELU | 34.84 | 34.92 | 27.84 | 33.46 | 30.62 | ReLU | 34.73 | 34.86 | 27.57 | 33.39 | 30.61 |
|
Table 5. Comparison of different activation functions in the 8-layer network structure
Evaluation indicator | Residual structure | Baby | Bird | Butterfly | Head | Woman |
---|
MSE | yes | 21.16 | 18.18 | 87.05 | 29.35 | 50.17 | no | 21.31 | 23.12 | 123.57 | 30.29 | 58.82 | SSIM | yes | 0.92 | 0.95 | 0.92 | 0.83 | 0.93 | no | 0.91 | 0.94 | 0.89 | 0.82 | 0.92 | PSNR /dB | yes | 34.88 | 35.53 | 28.73 | 33.45 | 31.13 | no | 34.84 | 34.49 | 27.21 | 33.32 | 30.43 |
|
Table 6. ELU activation function performance in 5-layer network structure
Evaluation indicator | Residual structure | Baby | Bird | Butterfly | Head | Woman |
---|
MSE | yes | 21.16 | 18.18 | 86.44 | 29.35 | 49.95 | no | 21.53 | 20.38 | 105.43 | 29.55 | 56.27 | SSIM | yes | 0.92 | 0.96 | 0.92 | 0.83 | 0.93 | no | 0.91 | 0.95 | 0.90 | 0.82 | 0.92 | PSNR /dB | yes | 34.88 | 35.65 | 28.76 | 33.54 | 31.15 | no | 34.79 | 35.03 | 27.9 | 33.42 | 30.62 |
|
Table 7. ELU activation function performance in 8-layer network structure
Evaluation indicator | Deconvolution | Baby | Bird | Butterfly | Head | Woman |
---|
MSE | yes | 21.09 | 17.69 | 86.44 | 28.79 | 49.95 | no | 21.16 | 18.18 | 87.05 | 29.35 | 50.17 | SSIM | yes | 0.92 | 0.96 | 0.92 | 0.83 | 0.93 | no | 0.92 | 0.95 | 0.92 | 0.83 | 0.93 | PSNR /dB | yes | 34.88 | 35.65 | 28.76 | 33.54 | 31.15 | no | 34.88 | 35.53 | 28.73 | 33.45 | 31.13 |
|
Table 8. Performance indicators of deconvolution and non-deconvolution
Method | Times /s | Method | Time /s |
---|
Eight layers with no residual | 31.638 | 5- layer network | 11.863 | Eight layers with residual | 30.071 | 8-layer network | 8.152 |
|
Table 9. Comparison of training time