Author Affiliations
11. Key Laboratory of Spectral Imaging Technique, Xi’an Institute of Optics and Precision Mechanics, Chinese Academy of Sciences, Xi’an 710119, China33. Shenzhen Yantian Port Group Co., Ltd., Shenzhen 518081, Chinashow less
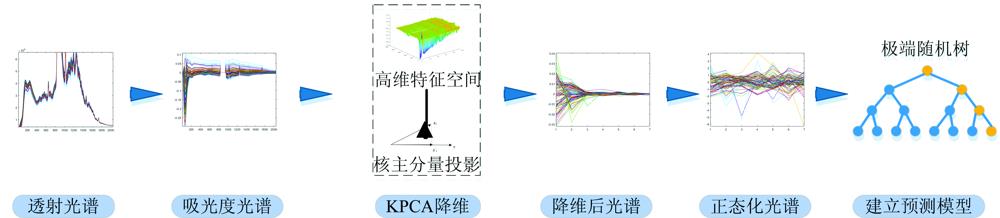
Fig. 1. Flowchart of IERT algorithm
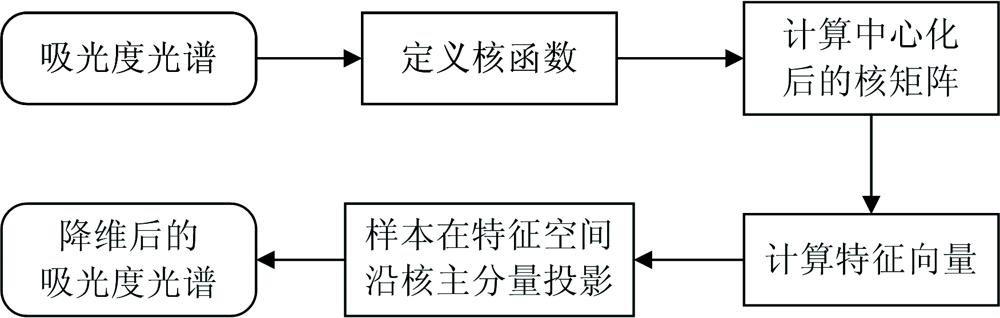
Fig. 2. Flowchart of KPCA algorithm
Fig. 3. Schematic diagram of experimental device
Fig. 4. Flowchart of extremely randomize trees algorithm
Fig. 5. Model diagram and physical diagram of the spectrometer
Fig. 6. Transmission spectra of multi-component mixed solutions
Fig. 7. Test set experimental results of IERT algorithm for COD, BOD5, TOC multi-component mixed solutions
(a): Comparison of the true value and the prediction value of COD;(b): Comparison of the true value and the prediction value of BOD5;(c): Comparison of the true value and the prediction value of TOC;(d): Relative error of COD prediction value; (e): Relative error of BOD5 prediction value;(f): Relative error of TOC prediction value
组分 | COD/ (mg·L-1) | BOD5/ (mg·L-1) | TOC/ (mg·L-1) |
---|
最小值 | 0.3 | 0 | 0.1 | 下四分位数 | 3.95 | 2.78 | 1.58 | 上四分位数 | 14 | 6.8 | 5.6 | 最大值 | 20 | 9.7 | 8 | 平均数 | 9.57 | 4.93 | 3.83 | 标准偏差 | 5.81 | 2.57 | 2.32 |
|
Table 1. The sample characteristics table of multi-component mixed solution dataset of COD, BOD5 and TOC
组分 | NO3-N/ (mg·L-1) | 浊度/ (mg·L-1) | 色度/ PCU |
---|
最小值 | 7 | 0.5 | 7 | 下四分位数 | 9 | 1.5 | 9 | 上四分位数 | 14 | 4 | 13 | 最大值 | 15 | 5 | 15 | 平均数 | 11.43 | 2.7 | 10.76 | 标准偏差 | 2.74 | 1.52 | 2.43 |
|
Table 2. The sample characteristics table of multi-component mixed solution dataset of NO3-N, turbidity and colority
核函数 | linear | polynomial | rbf | cosine | sigmoid |
---|
R2(COD) | 0.970 9 | 0.973 4 | 0.951 6 | 0.944 6 | 0.969 0 | R2(BOD5) | 0.372 3 | 0.383 5 | 0.328 0 | 0.413 2 | 0.408 6 | R2(TOC) | 0.970 5 | 0.974 8 | 0.958 4 | 0.948 4 | 0.968 6 | R2(ave) | 0.771 2 | 0.777 2 | 0.746 0 | 0.768 7 | 0.782 1 |
|
Table 3. Experimental results of IERT algorithm using different kernel functions
n | 2 | 3 | 4 | 5 | 6 | 7 | 8 | 9 | 10 |
---|
R2(COD) | 0.998 4 | 0.999 1 | 0.999 1 | 0.999 3 | 0.998 9 | 0.998 9 | 0.999 3 | 0.999 2 | 0.998 9 | R2(BOD5) | 0.970 1 | 0.984 1 | 0.985 1 | 0.990 3 | 0.982 8 | 0.985 1 | 0.985 2 | 0.970 1 | 0.970 9 | R2(TOC) | 0.998 6 | 0.999 1 | 0.998 9 | 0.999 2 | 0.998 9 | 0.999 2 | 0.999 3 | 0.999 0 | 0.999 1 | R2(ave) | 0.989 0 | 0.994 1 | 0.994 4 | 0.996 3 | 0.993 5 | 0.994 4 | 0.994 6 | 0.989 4 | 0.989 6 |
|
Table 4. The experimental results of the sigmoid kernel function when the number of principal components is selected as n
c | 0 | 1 | 2 | 3 | 4 | 5 | 6 | 7 | 8 | 9 | 10 |
---|
R2(COD) | 0.999 2 | 0.999 3 | 0.999 1 | 0.999 0 | 0.999 3 | 0.999 4 | 0.999 3 | 0.999 3 | 0.999 4 | 0.999 3 | 0.999 3 | R2(BOD5) | 0.988 2 | 0.988 4 | 0.987 1 | 0.989 7 | 0.990 3 | 0.988 7 | 0.991 4 | 0.988 8 | 0.988 2 | 0.989 9 | 0.988 8 | R2(TOC) | 0.999 3 | 0.999 3 | 0.998 9 | 0.999 2 | 0.999 3 | 0.999 3 | 0.999 3 | 0.999 2 | 0.999 3 | 0.999 3 | 0.999 1 | R2(ave) | 0.995 6 | 0.995 7 | 0.995 0 | 0.996 0 | 0.996 3 | 0.995 8 | 0.996 7 | 0.995 8 | 0.995 6 | 0.996 2 | 0.995 7 |
|
Table 5. Experimental results of sigmoid kernel function under different parameters c
m | 20 | 50 | 80 | 120 | 150 | 180 | 220 | 250 | 280 | 320 | 350 |
---|
R2(COD) | 0.998 6 | 0.999 2 | 0.999 2 | 0.999 6 | 0.999 2 | 0.999 4 | 0.999 4 | 0.999 3 | 0.999 5 | 0.999 3 | 0.999 5 | R2(BOD5) | 0.980 1 | 0.984 8 | 0.989 3 | 0.987 3 | 0.986 9 | 0.988 8 | 0.985 8 | 0.989 8 | 0.988 0 | 0.991 4 | 0.990 8 | R2(TOC) | 0.999 1 | 0.998 9 | 0.999 1 | 0.999 1 | 0.999 3 | 0.999 3 | 0.999 5 | 0.999 2 | 0.999 3 | 0.999 3 | 0.999 3 | R2(ave) | 0.992 6 | 0.994 3 | 0.995 9 | 0.995 3 | 0.995 1 | 0.995 8 | 0.994 9 | 0.996 1 | 0.995 6 | 0.996 7 | 0.996 5 | m | 380 | 420 | 450 | 480 | 520 | 550 | 580 | 620 | 650 | 680 | 720 | R2(COD) | 0.999 1 | 0.999 3 | 0.999 4 | 0.999 4 | 0.999 3 | 0.999 3 | 0.999 4 | 0.999 3 | 0.999 2 | 0.999 2 | 0.999 3 | R2(BOD5) | 0.988 0 | 0.990 1 | 0.990 4 | 0.990 0 | 0.987 8 | 0.988 6 | 0.987 7 | 0.990 0 | 0.990 2 | 0.989 3 | 0.989 3 | R2(TOC) | 0.999 3 | 0.999 2 | 0.999 3 | 0.999 2 | 0.999 2 | 0.999 1 | 0.999 0 | 0.999 2 | 0.999 3 | 0.999 3 | 0.999 3 | R2(ave) | 0.995 5 | 0.996 2 | 0.996 4 | 0.996 2 | 0.995 4 | 0.995 7 | 0.995 4 | 0.996 2 | 0.996 2 | 0.995 9 | 0.996 0 |
|
Table 6. Experimental results of IERT algorithm under different parameters m
评价标准 | 指标 | PLS | SVR | DT | ERT | IERT |
---|
| COD | 0.918 5 | 0.907 3 | 0.968 2 | 0.998 6 | 0.999 3 | R2 | BOD5 | 0.057 7 | 0.126 8 | 0.358 2 | 0.900 8 | 0.991 4 | | TOC | 0.918 9 | 0.935 2 | 0.965 1 | 0.998 1 | 0.999 3 | | COD | 2.866 8 | 3.262 4 | 1.118 3 | 0.046 6 | 0.024 4 | RMSE | BOD5 | 6.316 1 | 5.852 8 | 4.301 8 | 0.664 8 | 0.057 7 | | TOC | 0.453 8 | 0.362 2 | 0.195 0 | 0.010 6 | 0.000 4 |
|
Table 7. Comparison of evaluation parameters between IERT algorithm and 4 prediction algorithms for COD, BOD5, TOC multi-component mixed solutions
评价标准 | 指标 | PLS | SVR | DT | ERT | IERT |
---|
| NO3-N | 0.244 7 | 0.528 4 | 0.913 0 | 0.938 0 | 0.983 4 | R2 | 浊度 | 0.005 0 | 0.163 6 | 0.448 0 | 0.731 7 | 0.868 4 | | 色度 | 0.622 0 | 0.671 6 | 0.933 5 | 0.961 0 | 0.981 0 | | NO3-N | 4.571 4 | 2.854 6 | 0.526 3 | 0.375 0 | 0.100 5 | RMSE | 浊度 | 2.466 9 | 2.073 4 | 1.368 4 | 0.665 2 | 0.326 4 | | 色度 | 2.392 6 | 2.079 0 | 0.421 1 | 0.246 6 | 0.120 2 |
|
Table 8. Comparison of evaluation parameters between IERT algorithm and 4 prediction algorithms for NO3-N, turbidity, colority multi-component mixed solutions
算法 | PLS | SVR | DT | ERT | IERT |
---|
混合数据集1计算时间/s | 3.1 | 3.2 | 3.5 | 3.8 | 4.3 | 混合数据集2计算时间/s | 3 | 3.1 | 3.1 | 3.6 | 4.1 |
|
Table 9. Comparison of calculation time between IERT algorithm and 4 prediction algorithms