Author Affiliations
1Division of Life Sciences and Medicine, School of Biomedical Engineering (Suzhou), University of Science and Technology of China, Suzhou 215163, Jiangsu, China2Center of Light and Health, Suzhou Institute of Biomedical Engineering and Technology, Chinese Academy of Sciences, Suzhou 215163, Jiangsu, Chinashow less
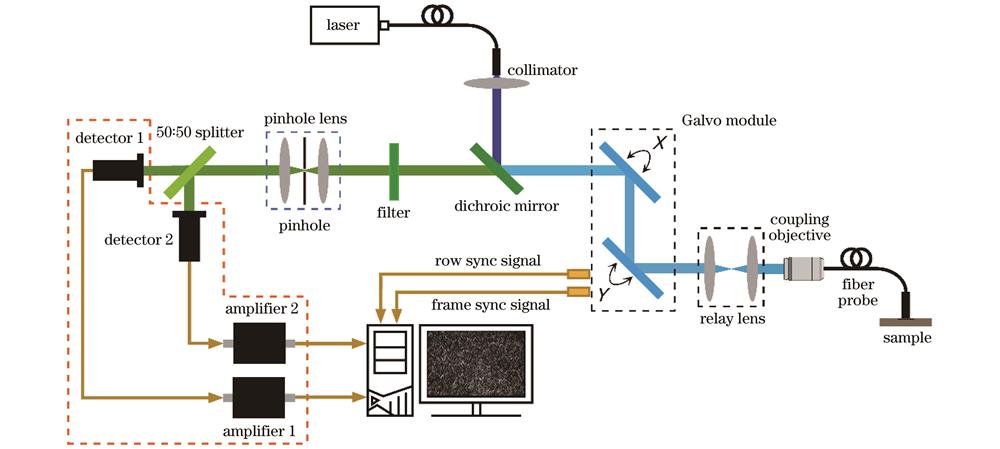
Fig. 1. Schematic of dual optical path CLE system
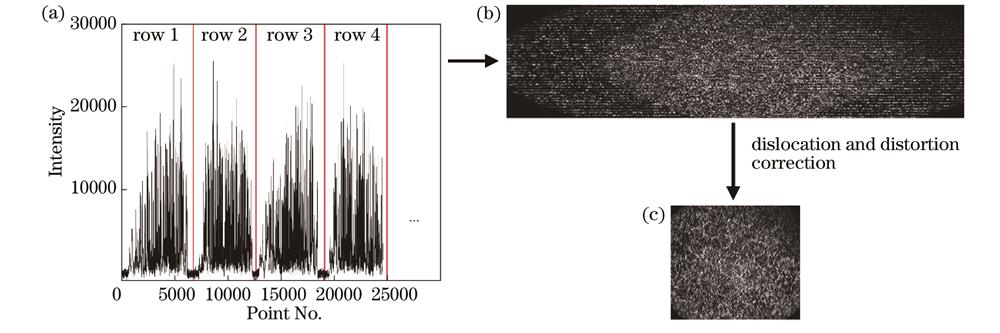
Fig. 2. Acquisition process of confocal images
Fig. 3. Schematic of image signal-to-noise calculation
Fig. 4. Detector performance comparison experiment device
Fig. 5. RSN_PMT of PMTSS varying with optical power
Fig. 6. Comparison of detector performance. (a) RSN_APD of APD120A2 varying with optical power; (b) RSN of different detectors varying with optical power
Fig. 7. Experimental results of uniform fluorescent solution imaging of APD120A2 and PMTSS
Fig. 8. Imaging results of fluorescent samples and statistics results of the number of pixel points under different optical powers.(a)-(c) Fluorescent beads; (d)-(f) lens tissue; (g)-(i) upper epidermis of Photinia serrulata leaves; (j)-(l) lower epidermis of Photinia serrulata leaves
Fig. 9. Summary of for imaging fluorescent samples. (a) Boxplot of image SNR; (b) relationship between image SNR and imaging average optical power
Parameter | PMT | APD |
---|
Detector | PMTSS | APD120A2 | Price(CNY) | 28663.91 | 11944.83 | Active area diameter | 3.7 mm×13.0 mm | Φ1 mm | Bandwidth /MHz | 250 | 50 | Dark current /nA | 2(Typical);10(Max) | — | NEP /(pW·Hz-1/2) | — | 0.21(DC-50 MHz) | Amplifier | C9999(50 mV/μA) | DHPVA-101(20 dB) |
|
Table 1. Configuration and parameters of detectors
Condition | PMT | APD |
---|
Detector | PMTSS | APD120A2 | | Optical power | Start at 5 nW,end at 50 nW,step size is 5 nW | | Sample rate | 125 MHz | | Gain voltage | 0.313 V,0.342 V,0.374 V | fixed | |
|
Table 2. Data collection conditions of detector performance comparison experiment
Parameter | Value | Parameter | Value |
---|
η | 24%(PMTSS) | VAmpPMT | 2.6 mV(RMS) | e | 1.6×10⁻¹⁹ C | VAmpAPD | 283 μV(RMS) | λ | 525 nm | PNE | 0.21 pW/ | h | 6.62607015× 10⁻³⁴ J·s | Giv | 50000 | c | 3×10⁸ m/s | Gmodule | 50000 | B | 10 MHz | Gv | 10 | | 10 nA | Rs | 22.3 A/W | Ma | 50 | F | |
|
Table 3. Parameter values used for the SNR calculation
Condition | PMT | APD |
---|
Detector | PMTSS | APD120A2 | Solution | 75 mL fluorescein sodium solution with mass concentration of 0.0067%,0.0133%,0.02%,0.0267%,and 0.0333% g/mL | Gain voltage | 0.342 V | fixed | Sample rate | 125 MHz | Amount of data | Acquire 120 consecutive images for each condition |
|
Table 4. Uniform fluorescent solution experimental conditions
No. | Sample | Preparation |
---|
S1 | Lower epidermis of Photinia serrulata leaves | Avoid the main veins and cut out a number of small square leaves,soak them in 1% sodium fluorescein solution for 96 h,rinse and dry the epidermis before the experiment | | S2 | Upper epidermis of Photinia serrulata leaves | Avoid the main veins and cut out a number of small square leaves,soak them in 1% sodium fluorescein solution for 72 h,rinse and dry the epidermis before the experiment | | S3 | Lens tissue | 0.0333% sodium fluorescein solution sprayed and dried | | S4 | 13 μm fluorescent beads | Pipette 5 μL of fluorescent beads(FL-PS-G-13,TJDAE technology)onto the glass slide and dry | |
|
Table 5. Fluorescence sample selection and preparation