Yuanhong Yang, Fuling Yang, "High performance fiber optic gyroscope with a radiation-tolerant and temperature-stable scale factor," Chin. Opt. Lett. 14, 110605 (2016)
Copy Citation Text
A simple wavelength-independent scale factor model is established for a closed-loop interferometer fiber optic gyroscope (IFOG) and a method to keep the scale factor radiation tolerant and temperature stable in a high performance IFOG for space application is proposed. The half-wave voltage () of the multifunction gyro chip at different wavelengths and temperatures is measured and the radiation-independent inherent parameter of the modulator is picked out and found be proportional to the temperature and slightly wavelength dependent. An experimental IFOG is developed and the scale factor is measured at different temperatures and under irradiation, respectively. Less than a 10 ppm scale factor instability is achieved within the to temperature range and more than 100 krad(Si) total radiation dose.
The fiber optic gyroscope with the unique characteristics of long life, high reliability, and light weight is one of the most important gyroscopes for spacecraft and satellite applications[1–3]. However, a satellite in geosynchronous orbit may receive more than 100 krad total dose for a more than 5 year mission, and this may induce a big attenuation in the interferometer fiber optic gyroscope (IFOG) optical circuit and a large mean-wavelength shift to the light source. The radiation effect will result in a long-term mean-wavelength drift and output power loss[4]. The limited power loss may not degrade the performance of the closed-loop IFOG seriously, but the mean-wavelength drift will bring a large scale factor (SF) error. There have been a number of approaches, such as employing a second servo loop[5] or a “four-state” biasing modulation[6] and compensation based on the temperature model[7] to keep the SF stable. However, these approaches cannot reduce the SF error due to the wavelength drift induced by irradiation. So there is a stringent requirement of mean-wavelength drift for a high performance IFOG[6]. The erbium-doped super-fluorescent fiber sources (SFSs) have a high mean-wavelength stability, high power, and broad linewidth and usually serve as an optical source for a high performance IFOG[8]. However, the mean wavelength of SFSs that suffers severely from radiation can hardly be controlled or compensated because it is very difficult, complicated, and costly to monitor the mean-wavelength of a source integrated in an IFOG[9] and few methods were reported. Many approaches were reported to reduce the output spectrum variation of SFSs[10,11] and less than 100 ppm wavelength stability was achieved in an SFS prototype under a total gamma-ray irradiation dose of about 200 krad(Si)[9,11]. This will bring about 100 ppm of SF error to the IFOG.
In this Letter, we deduced a simple wavelength-independent SF model for an IFOG based on the wavelength-dependent half-wave voltage () of a multifunction gyro chip (MIOC) and proposed a scheme to keep the SF radiation tolerant and temperature stable in a high performance IFOG under a radiation and temperature fluctuation environment. The model at different wavelengths and temperatures was obtained and the inherent parameter of the modulator was picked out and analyzed. A practical SF compensation method was developed and integrated in the experimental IFOG. Less than 10 ppm SF instability was achieved within a to temperature range and more than 100 krad(Si) total radiation dose.
For a closed-loop IFOG, SF can be expressed as[12]where is the length of the optical fiber coil, is the mean diameter of the optic fiber coil, is the mean wavelength of the light source, is the speed of light, is the peak-to-peak voltage that generates a phase shift, and is the digits of the D/A converter in the signal detection circuit. is the voltage that generates a rad phase shift and can be expressed as[13]where is the electrode spacing, is the electrode length, is the effective refractive index, is electro-optic coefficient, and is the overlap integral factor.
Sign up for Chinese Optics Letters TOC. Get the latest issue of Chinese Optics Letters delivered right to you!Sign up now
As shown in Eqs. (1) and (2), and are direct error sources of and they may drift seriously under a fluctuant temperature and irradiation environment. Conventional second servo loop and temperature compensation on can only keep stable or compensate the error due to drift[5–7]. Namely, only the second factor in Eq. (1) can be controlled by adjusting or compensation. However, the SF error induced by the first factor due to shift cannot be processed. Furthermore, the shift may bring drift to , as shown in Eq. (2). That is why there are stringent requirements of mean-wavelength drift in high performance IFOGs. In the space field, irradiation and temperature may effect both and simultaneously, and the mean-wavelength drift of the source can hardly be monitored. There are a few publications on MIOC radiation characteristics and the study result show that radiation does not affect the of MIOC[14,15]. Combining Eqs. (1) and (2), can be rewritten as where is defined as the inherent modulator parameter. From Eqs. (1)–(4), we can see that it is the radiation independence of that lets be stable under the irradiation environment. Equation (3) shows that can be independent of the source wavelength and could be stable under a large dose of radiation. Equation (4) shows that it is the value variety under different temperatures that produces a temperature-dependent . If the value of can be stabilized by compensating with a suitable model, the may be stable under large doses of radiation and temperature fluctuation conditions.
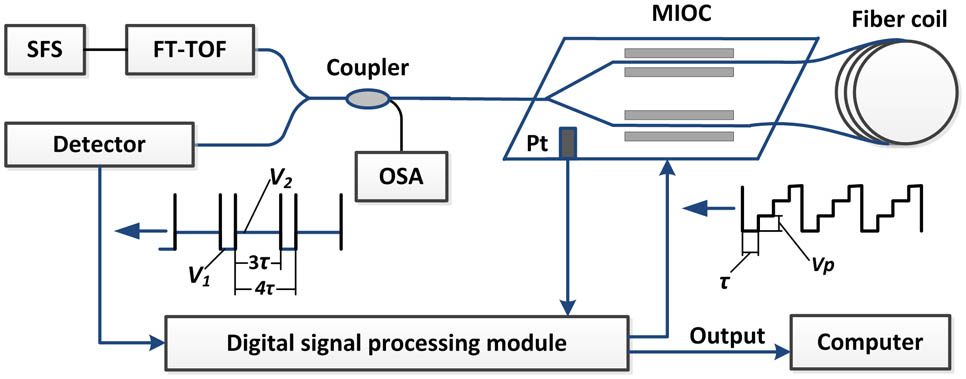
The values have been measured based on a “four-step” wave modulation technology in the IFOG system[16]. As shown in Fig. 1, it is composed of an SFS, a flat-top tunable optical filter (FT-TOF), a coupler, an MIOC with a Pt temperature sensor for a temperature monitor, a fiber coil, a detector, a digital signal processing module, and a computer. The SFS and FT-TOF form a tunable source and the optical spectrum analyzer (OSA) is used to monitor the source wavelength. The “four step” waveform with an equal height and a fixed time width ( is the time of optical transmission in the fiber coil) was added onto the modulator. Adjusting from low to high, when the detector output signal is equal to (shown in Fig. 1) for the first time, the is and the accurate measurement is realized. Because of the perfect reciprocity Sagnac optical circuit and periodic modulation, the optical circuit loss, possible Sagnac phase shift, and ambient temperature fluctuation in this measure system have no effect on the measurement result.
Figure 1.Schematic diagram of the measurement system.
In the modified measure system shown in Fig. 1, the source wavelength can be selected within the C band and the bandwidth is about 1 nm, the at different wavelength components can be measured independently, and the signal noise is depressed. The performance of the measurement system was investigated first. The MIOC operation wavelength is and its nominal is 3.395 V at 25°C. The MIOC was placed only in the temperature chamber with a 0.5°C temperature stability. During the experiment, the temperature in the chamber and the source wavelength were set to 30°C and 1548.51 nm, respectively. The value was recorded for 1 h with a 1 s sampling interval. The test results are shown in Fig. 2; the average value of is 3.3881 V, and the standard deviation is 26 μV (, 10 s integral). This may be the best measurement accuracy of currently reported and supports an in-line precision method for characteristics investigation.
The value was measured at different temperatures and wavelengths with this system. The temperature in the chamber was set within the to temperature range at 10°C intervals and the wavelength was selected within the C band with about a 5 nm interval. When the temperature was stable at the set value, the value was measured at each selected wavelength from 1528.38 to 1567.95 nm. During testing, the sampling interval was 1 s and the test period was about 30 min at each wavelength. The averages of the , temperature, and wavelength during each testing period were recorded.
Based on Eq. (4), the inherent parameter was picked out by dividing by the selected and the curves were plotted in Fig. 3. is linear with wavelength and temperature, respectively, while the slopes are positive and negative, respectively. The linear fitting model parameters were listed in Tables 1 and 2, respectively. The parameters were both greater than 0.999 and proved good linearity. However, there is an intercept in the linear fitting model of versus because and in Eq. (4) have chromatic dispersion properties[17,18] and this may bring an error to in Eq. (3).
Figure 3.Relationship of versus at different temperatures.
To estimate the error of due to being wavelength dependent, taking the value of at a mean wavelength 1548.513 nm as the normal value and assuming the mean-wavelength relative variety is about 100 ppm (about 0.155 nm mean-wavelength shift) after radiation, we calculated the SF error within this small wavelength range and the calculated results were listed in Table 3. The maximum absolute SF error is about 4.47 ppm at the maximum and minimum wavelength symmetrically because of the linear model. This demonstrates that the chromatic dispersion of is slight and the effect on can be neglected. Generally, a 100 ppm wavelength shift may induce 100 ppm SF error, as Eq. (1) shows. The SF error can be less than 10 ppm under the same conditions with the proposed method, as Eqs. (3) and (4) described, and more than a tenfold error suppression could be achieved.
Figure 4 shows the configuration of the experimental IFOG. A radiation resistant SFS was used with less than a 100 ppm mean-wavelength shift after about a 200 krad(Si) total dose of radiation[11] and the length fiber coil was wrapped with radiation resistant polarization maintaining fiber made by the 46th Institute of China Electronics Technology Group Corporation. The SFS, photonic detector (PD), fiber coupler, MIOC, and fiber coil were integrated in an optical module. A digital signal processing module was connected with the optical module by a cable. Because the electronic circuit cannot stand a large dose of radiation, a lead shell was placed between the optical and signal processing modules during the radiation experiment. The dead port D of the fiber coupler was leaded out for the source wavelength measurement.
The value of MIOC used in the experimental IFOG was measured with the “four step” modulation method at different temperatures and its inherent parameter was calculated at a mean wavelength of 1548.538 nm of the SFS. The temperature model of was obtained as follows:
The all-digital closed-loop processing method was developed to get the rotation rate, and two demodulation implementations were designed. One is the conventional method with a second feedback loop to keep stable[5] and another is the aforementioned method with a temperature compensation algorithm based on the temperature model described by Eq. (5). The temperature of the MIOC was monitored by a precision Pt probe and a linear temperature compensation algorithm was inserted in the signal processing software to keep stable.
During the temperature experiment, the optical module was mounted on the rotation stage with a temperature chamber. The temperature in the chamber was set to within to , with a 20°C interval. At each temperature, the zero bias drift and the SF were tested with the above two demodulation methods when the temperature was stable. The bias drifts were both less than 0.01°/h (, 10 s integral) at each stable temperature. As shown in Fig. 5, the mean wavelength shifted 0.583 nm (black diamond), and the SF error (red circle) is about 367.90 ppm with the conventional demonstration method. Meanwhile the SF error (blue triangle) is about 7.84 ppm with the proposed compensation method. This demonstrated that the SF error can be depressed effectively by compensating a variety of inherent parameters .
Figure 5.Wavelength shift and SF errors at different temperatures.
Figure 4 shows the radiation experimental system, a non-spool fiber coil was fabricated and the optical and signal processing modules were both mounted in a radiation room and a thick lead shell was placed between the two modules to guard the electronic circuits from radiation. The photograph is shown in Fig. 6. The radiation dose rate and the total dose was about 1 rad/s and more than 100 krad(Si), respectively. The IFOG was powered on during the radiation experiment and a long cable was used to transmit the rotation rate data to a computer for recording. This experiment took about 28 h and the SF error was tested every , which was corresponding to about a 20 krad(Si) radiation dose increment. During the SF testing procedure, the whole system was taken out from the radiation room and mounted on the rotation stage and the SF error was tested. The source mean wavelength was recorded simultaneously. Each SF test was done within less than 30 min to guarantee that possible “photo-bleaching” can be neglected[11]. The tested SF error (blue triangle) and mean wavelength (black diamond) are shown in Fig. 7. For comparison, the SF error (red circle) with the conventional calculation based on Eq. (1) with the tested mean wavelength. The experimental total dose is about 101 krad, which shifted the mean wavelength about 0.162 nm, and the SF maximum error is about 8.33 ppm while the calculated SF error is about 102.15 ppm. The experimental results prove that the method proposed in this Letter is effective in restraining the SF error caused by the wavelength shift of the light source under radiation circumstances.
In conclusion, we deduce a simple wavelength-independent SF model because in the IFOG is linear with the wavelength of the source and propose a scheme to keep the SF radiation tolerant and temperature stable by compensating the variety of inherent parameters of the modulator instead of controlling or compensating with the conventional method. We precisely measure the value of the MIOC at different wavelengths and temperatures and picked out the inherent parameters of the modulator and found that it is proportional to the temperature and slightly wavelength dependent. Analysis proves that the SF due to being wavelength dependent can be neglected. We develop a high performance experimental IFOG with less than a 0.01°/h bias drift and test its SF error experimentally at different temperatures and under irradiation. Less than a 10 ppm SF instability is achieved within a to temperature range and more than a 100 krad(Si) total radiation dose. For comparison, the SF instability is greater than 100 ppm under the same conditions with the conventional demodulation and parameters control method. This proves that the high performance fiber optic gyroscope with a radiation-tolerant and temperature-stable SF can be realized with the proposed compensation method and this method can greatly relax the requirement on the stability of the source mean wavelength in a high SF performance IFOG.
[13] S. T. Chen, J. H. Cheng, W. Gao. Proceedings of International Conference on Mechatronics and Automation, 37(2008).
[14] D. F. Ding, G. J. Liu, J. Li, J. C. Liu, P. Lu. Proceedings of Academic International Symposium on Optoelectronic and Microelectronics Technology (AISOMT), 216(2011).