
Gui JIN, Xin SHI, Dawei HE, Baishu GUO, Zhaohua LI, Xianbin SHI. Designing a spatial pattern to rebalance the orientation of development and protection in Wuhan[J]. Journal of Geographical Sciences, 2020, 30(4): 569
- Journal of Geographical Sciences
- Vol. 30, Issue 4, 569 (2020)
Abstract
Keywords
1 Introduction
The goals of constantly optimizing the pattern of national spatial development and constructing an ecological civilization were proposed at the 19th National Congress of the Communist Party of China (CPC) in 2017. The document stated that the state had upgraded the optimization of patterns of spatial development to the national strategic level, and considered it an important foundation for ecological civilization construction (
In the backdrop of promoting well-coordinated environmental conservation and avoiding excessive development, it is important to form patterns for the development and protection of space to use it efficiently, create a livable space, and ensure that the ecological space is unspoiled. Based on a combination of point-axis theory and the theory of patterns of ecological safety, we selected Wuhan as study area and used the random walk theory and MCR to implement function recognition. Quantitative description of the axis of development and a comprehensive expression of the spatial form of the natural-human system are also provided. Scientific patterns of spatial development and protection for Wuhan can provide reference for decisions on the regional ecological civilization construction and the management of natural resources.
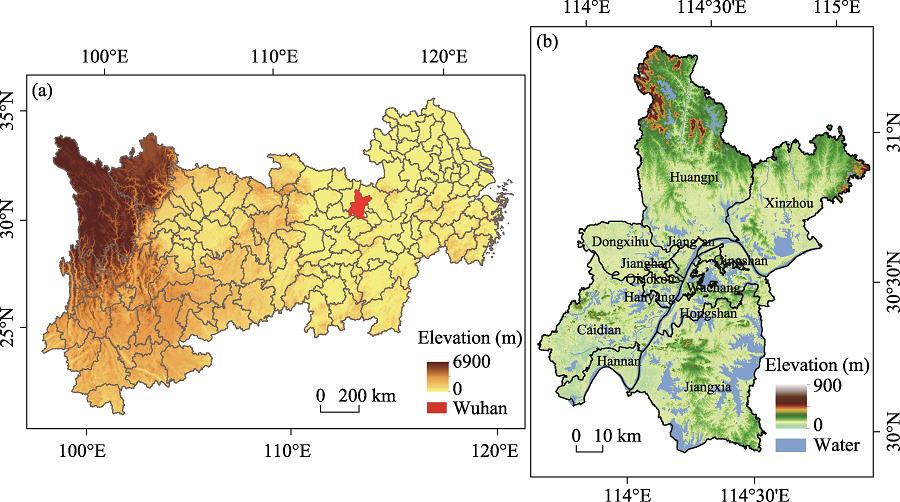
2 Study area
Wuhan is located in central China, in the middle reaches of the Yangtze River, and is an important node city for the Belt and Road Initiative (
![]()
Figure 1.
3 Data and methods
3.1 Data sources and processing
The research data included natural environmental data to characterize the indigenous ecosystem and socioeconomic data to reflect the appropriate needs of the relevant human activities. The natural environmental data included the following: (1) Data from meteorological stations of the National Meteorological Information Center (
3.2 Minimum cumulative resistance
On the basis of geography theory and geographic information, the MCR has been proposed to quantify the cost or the minimum resistance of the object from the source through different patches to the destination (
where MCR denotes the minimum cumulative resistance, Dij represents the spatial distance of spatial elements flowing from core area j to the specified unit i, Ri represents the coefficient of resistance of spatial unit i to the elements, and ƒ represents the positive correlation function between the minimum cumulative resistance and the process of spatial expansion. Based on this model, the grid matrix can be used to construct the resistance matrix in combination with the spatial position, following which the surface feature of resistance can be simulated, that is, the resistance surface of the spatial pattern can be extracted.
The spatial characteristics of the elements flow revealed by the MCR reflect the possibility and trend of the spatial structure, and are used to measure the change in overall connectivity by adjusting channel width (
3.3 Circuit theory model
The circuit theory model links the state of motion of an object to resistance to it based on random walk to yield the trajectory of spatial motion (
The basic indicators of the circuit theory model are current I, voltage V, and resistance distance DR, where the latter is the decisive factor in the formation of connections during spatial development, and its value is determined by the size of the plaque and number of paths. When two nodes can be connected through multiple paths with low resistance, the resistance distance is small; when they can be connected through few paths with high resistance, the resistance distance is large. The current, voltage, and resistance distance are calculated as follows (
(1) Current: When the spatial element flows from node A to node B, the current ixy of adjacent nodes x and y is the expected value of the net number of times it flows through the directed edge xy during the random walk of the element from A to B, as follows:
where ux=∑y uypyx represents the average number of times the spatial element reaches state x before reaching node B, uxpxy represents the average number of times a spatial element flows from x to y, uypyx represents the average number of times a spatial element flows from y to x, ixy represents the average net number of spatial elements flowing between x and y, and Cxy denotes the conductance of x and y, which is used to measure the flow capability of spatial elements between nodes, and has the properties Cxy=Cyx=1/Rxy, Cx=∑yCxy, and Cy=∑xCyx. Pxy represents the element of the transfer matrix P, Pxy=Cxy/Cx, which is used to characterize the spatial pattern (assumed to be G) formed by points and lines according to the trajectory of random walk that conforms to the Markov chain.
(2) Voltage: When there is a spatial relationship between nodes A and B, and A is the starting point of the process of elements flow, the voltage vx of point x indicates the probability that the spatial elements return A from x before returning to B, as follows:
(3) Resistance distance: The resistance distance between nodes u and v is expressed by R(u, v), that is, the degree of connectivity between nodes u and v in the spatial pattern (
The resistance distance characterized by the Wiener index is as follows:
where d(u)=dG(u) and d(v)=dG(v) denote the number of axes connecting nodes u and v on the spatial network, respectively.
Applying the framework of circuit theory to study regional patterns can improve the understanding of new regional patterns shaped by the flow of spatial elements and provide means for interpreting complex geographical changes. Based on this framework, we propose research ideas at three levels of a system composed of the core area, resistance surface, and axis of development. The urban node network is characterized as a circuit, resistance values are set according to the suitability of the spatial unit, and the connectivity of regional units is measured using the resistance distance (
![]()
Figure 2.
3.4 Identifying core area and extracting resistance surface
This study aims to clarify the scientific connotation of the patterns of ecological security identified by the evaluation indicators of the importance of the habitat, its ecological sensitivity, and the connectivity of its landscape (
3.5 Characterizing development axis and constructing the geospatial pattern
Geospatial data were converted into a graph structure and the Laplacian operator was constructed to calculate the effective resistance, current, and voltage. All possible paths were then integrated into the calculation of distance to identify the potential axes of spatial development by an analog simulation of the flow of spatial elements (
| Terms | Geographical significance |
|---|---|
| Current | Probability of each element flowing through a geographic unit in the pattern of spatial protection and development |
| Resistance | The resistance to development of the spatial unit; the geographical unit with a tendency toward protection is assigned a high resistance value |
| Voltage | The probability that the spatial element leaves a node and successfully reaches a specified node is also the probability that two nodes can be connected through the axis |
| Effective resistance | Resistance distance of different paths between nodes |
| Ground | Endpoint of the spatial development axis |
Table 1.
Comparison of physical terms and their geographical significance in circuit theory
4 Results and analysis
4.1 Core area and resistance surface
The core areas were identified by integrating the calculations of population density, GDP density, traffic accessibility, and rate of land urbanization to express the characteristics of spatial differences that were suitable for human activities. We selected 20% as the key threshold for the identification of the core areas (
![]()
Figure 3.
The extraction of the resistance surface requires the comprehensive consideration of natural indigenous characteristics and the needs of human ecological security. An index system that considers ecological sensitivity and the importance of ecosystem services based on this consideration can have important scientific and policy-related implications. The global feature of the resistance surface extracted by the ensemble algorithm was the “inverted pyramid” distribution in which the resistance decreased from the periphery to the center (
4.2 Development axis and geospatial pattern
Based on the MCR, “linear” channels with a maximum width of 6 km between the core areas were extracted by the Linkage Mapper as the axis of development to quantitatively describe the spatial characteristics of elements flow (
![]()
Figure 4.
Based on the measured results of the resistance distance between core areas, we used iterative calculation to obtain their current densities, where this reflected the degree of spatial connections of each core area in Wuhan. The resistance distance could identify the potential characteristics of spatial connections under the condition that other factors were uniform to quantificationally reflect the important features and spatial structure of the spatial elements. The results show that the resistance distances of core areas 1-2, 1-4, 2-4, 4-5, and 4-6 were all shorter than 10, whereas the resistance distances of core areas 1-7, 2-3, 2-7, 3-5, 3-6, and 3-6 were all longer than 20. When the resistance distance was longer than 13, a direct connection could not be formed between the core areas (
| Code of core area | Code of core area | |||||
|---|---|---|---|---|---|---|
| 2 | 3 | 4 | 5 | 6 | 7 | |
| 1 | 5.06 | 17.71 | 6.75 | 17.95 | 17.34 | 26.01 |
| 2 | 21.31 | 5 | 15.11 | 15.37 | 23.26 | |
| 3 | 16.22 | 29.15 | 27.77 | 37.1 | ||
| 4 | 4.87 | 5.03 | 13.72 | |||
| 5 | 13.29 | 12.8 | ||||
| 6 | 19.25 | |||||
Table 2.
Resistance distance between pairwise cores
As a representative indicator of resistance distance and the importance of core areas, current density was used to characterize the spatial correlation between a core area and adjacent core areas. The highest current density in Wuhan was about 1495.27 km², and appeared as a “center-peripheral” layered sphere in which core areas 1-2-4 and 4-5-7 were the “two peaks” of current density. The high current density around core areas 1 and 2 showed a “planar” spatial distribution, which provides strong support for the flow of spatial elements between core areas. Regions of high current density between core areas 4 and 5 were “linearly” distributed (
To construct a practical hierarchical system for spatial development and protection in Wuhan, a structure consisting of ordered core regions at three levels was set up. The first level was core area 4 with central urban areas as the main body. There were six core areas at the second level, and those at the third level were strategic points that influenced the development axes. Core regions at the third level (strategic point) were invisible growth points of spatial development based on the axis of development characterized by the least-cost path, and coupled with current density for the recognition of spatial morphological features (
![]()
Figure 5.
According to the results of identification of the core areas and characterization of the development axes, the spatial development framework of “one heart, two wings, and three belts” was conceived. “One heart” refers to core area 4 with central urban areas as the main body. As the region of the aggregation of spatial elements and strategic pivot of spatial development, it undertook regional political, cultural, and economic functions. “Two wings” refers to the development groups of the northwestern in Qianchuan and Tianhe, and in the southwest in the Caidian Economic Development Zone and Dengnan. “Three belts” refers to the axes of development of Huangpi-Jiangxia, Xinzhou-Caidian, and Dongxihu-Optics Valley. Given this spatial development and protection framework of “one heart, two wings, and three belts,” imbalance in spatial development can be recognized. Preferential policies should be formulated for the core areas to promote the formation of a regional development model “from point to region.”
5 Conclusions and discussion
5.1 Conclusions
Patterns of development and protection form the scientific basis for a feasible layout of spaces for production, living, and ecology as well as the theoretical basis for the overall coordination of their economic, social, and ecological benefits. Based on basic geographic information and data from statistical yearbooks, we used circuit theory and the MCR in this paper to construct a pattern for the development and protection of Wuhan, and formulated a comprehensive expression for the spatial structure of core areas-resistance surface-develop- ment axes. The results show the following: First, the population density, GDP density, access for traffic, and rate of land urbanization were used to identify seven core area of development that consisted of 111 streets and accounted for about 20% of the total area of Wuhan. The distribution of the core areas exhibited a spatial distribution of “circular satellites,” and distributions in mosaic form were highly consistent with the administrative center. Second, the resistance surface, which was extracted by determining the importance of ecosystem services, ecological sensitivity, land use type, and terrain slope, was mainly distributed in ecological spaces that offered large ecological benefits, such as the central regions of Huangpi and Xinzhou, and southwest Caidian. Areas with low and high values of resistance to spatial development in Wuhan accounted for 6.64% and 12.53% of the city’s total area, respectively. Third, based on the least-cost path and current density, nine spatial development axes and eight strategic points were identified, and a channel for elements flow centered on core area 4 was formed. The area of the zone where construction was emphasized was 467.29 km². The inconsistency between the development axis and distribution of current density was revealed, and the problem of arriving at incorrect conclusions by setting the width of the development axis subjectively was avoided. Finally, we constructed the pattern of the spatial development and protection of Wuhan using the idea of “one heart, two wings, and three belts”, and recommended that the government formulate preferential policies for strategic areas to form a regional development mode “from point to region” in the new era.
5.2 Discussion
Research on constructing patterns of ecological security featuring development and protection axes are common, but spatial contradictions have been noted in such analyses when a non-uniform framework is used. On the basis of the summary and conclusion of the characteristics of spatial structure under the field of “function and system” in geography, a basic understanding of the “point-axis-area” spatial structure was provided. “Point” is the source of power driving the spatial elements to flow. “Axis” is the carrier of elements that connect and interact with the each other at “points,” and the points and axes work together on geographic entities to form patterns of development and protection. At the same time, the development axes based on the resistance surface can guide the layout of spatial elements, arrange the order of spatial development, and minimize the impacts of spatial development-related activities on functions of ecosystem services. Therefore, by analyzing the characteristics of the spatiotemporal distribution of elements of the nature-society-economy system and the spatial structure of the “point-axis-area,” patterns for the spatial development and protection of core areas were constructed by using the circuit theory model and MCR as a useful complement to prevalent research on spatial structure. Through the comparative analysis with the current development situation of Wuhan, the seven core areas, nine development axes and eight strategic points identified in this study are highly consistent with the trend of spatial development and protection in Wuhan, which shows that the research results are consistent with the objective facts. For example, the flow of spatial elements in Hankou is significantly higher than that in Wuchang, and the streets on the axis connecting core area 1 and core area 4 are developing rapidly.
However, there are still some limitations to this study: First, due to the unavailability of data, the spatiotemporal resolution of the smallest research unit used in this study was at the sub-district level, and thus failed to break through the administrative boundary, identify core areas, characterize the development axes, and construct patterns of development and protection at a high resolution. In future work, we plan to introduce datasets consisting of streaming data, urban POI data, and night-light data to research high-resolution geographical patterns. Second, the basis of the patterns of spatial development and protection is spatial planning given the requirement of ecological civilization construction based on the heterogeneous characteristics of the spatial elements. However, the heterogeneity and homogeneity of geographic elements have prominent scale effects. Thus, studying the construction of spatial patterns at different scales can provide comprehensive guidance for formulating policies for regional development. Third, the research on the construction of the spatial pattern based on the existing basic data reflects the comparative advantages of the spatial elements under historical accumulation, and the identified spatial pattern is the heritage and continuation of the existing space development and protection. But on the summary of the existing space development laws, there is a risk of continuing the early blind development and protection. It's necessary to further study the inherent differences in the flow patterns of elements under different scenarios in the space development trade-off as a reference and choice of space development and protection solutions for policy makers and planners. Finally, policy orientation as an important factor in the ultimate blueprint for development and the path of implementation were not adequately considered in the theoretical exploration and practical argument. Territorial space-related policies with a single development goal, with characteristics of local rather than global optimality, struggle to meet regional developmental needs that are multi-objective, multi-path, and multi-concept. Thus, guiding the transition of policy from local to global optimization should be the focus of scientific research on patterns of spatial development and protection.
References
[1] C Avon, L Bergès. Prioritization of habitat patches for landscape connectivity conservation differs between least-cost and resistance distances. Landscape Ecology, 31, 1551-1565(2016).
[2] S Azaele, A Maritan, J Cornell S et al. Towards a unified descriptive theory for spatial ecology: Predicting biodiversity patterns across spatial scales. Methods in Ecology and Evolution, 6, 324-332(2015).
[3] C Blatti, S Sinha. Characterizing gene sets using discriminative random walks with restart on heterogeneous biological networks. Bioinformatics, 32, 2167-2175(2016).
[4] S Blazquez-Cabrera, A Gastón, P Beier et al. Influence of separating home range and dispersal movements on characterizing corridors and effective distances. Landscape Ecology, 31, 2355-2366(2016).
[7] X Chen M, D Liu W, D Lu D et al. Progress of China’s new-type urbanization construction since 2014: A preliminary assessment. Cities, 78, 180-193(2018).
[8] A Correa Ayram C, E Mendoza M, A Etter et al. Habitat connectivity in biodiversity conservation: A review of recent studies and applications. Progress in Physical Geography, 40, 7-37(2016).
[9] K Costanza J, J Terando A. Landscape connectivity planning for adaptation to future climate and land-use change. Current Landscape Ecology Reports, 4, 1-13(2019).
[10] A Dobrynin A, A Kochetova A. Degree distance of a graph: A degree analogue of the Wiener index. Journal of Chemical Information and Computer Sciences, 34, 1082-1086(1994).
[11] J Fan. “Territorial system of human-environment interaction”: A theoretical cornerstone for comprehensive research on formation and evolution of the geographical pattern. Acta Geographica Sinica, 73, 597-607(2018).
[12] V Ferretti, S Pomarico. An integrated approach for studying the land suitability for ecological corridors through spatial multicriteria evaluations. Environment, Development and Sustainability, 15, 859-885(2013).
[13] Q Huang, Y Zeng, Q Jiang. Progress and prospect of the study on “making great efforts to promote ecological civilization construction”. China Population, Resources and Environment, 25, 111-120(2015).
[14] G Jin, K Chen, P Wang et al. Trade-offs in land-use competition and sustainable land development in the North China Plain. Technological Forecasting and Social Change, 141, 36-46(2019).
[15] G Jin, Z Deng X, X Chu et al. Optimization of land-use management for ecosystem service improvement: A review. Physics and Chemistry of the Earth, 101, 70-77(2017).
[16] G Jin, Z Deng X, D Zhao X et al. Spatiotemporal patterns in urbanization efficiency within the Yangtze River Economic Belt between 2005 and 2014. Journal of Geographical Sciences, 28, 1113-1126(2018).
[17] G Jin, H Li Z, Z Deng X et al. An analysis of spatiotemporal patterns in Chinese agricultural productivity between 2004 and 2014. Ecological Indicators, 105, 591-600(2019).
[18] J Klein D, M Randić. Resistance distance. Journal of Mathematical Chemistry, 12, 81-95(1993).
[19] A Kupfer J. Landscape ecology and biogeography: Rethinking landscape metrics in a post-FRAGSTATS landscape. Progress in Physical Geography, 36, 400-420(2012).
[20] B Leonard P, B Duffy E, F Baldwin R et al. Gflow: Software for modelling circuit theory-based connectivity at any scale. Methods in Ecology and Evolution, 8, 519-526(2017).
[21] C Li S, L Bing Z, G Jin. Spatially explicit mapping of soil conservation service in monetary units due to land use/cover change for the Three Gorges Reservoir Area, China. Remote Sensing, 11, 468(2019).
[22] T Liu H, L Tian L, Y Tian et al. Exploring the spatial expression and governance policies of urban sprawl in Wuhan. Economic Geography, 35, 47-53(2015).
[23] H Luo F, X Liu Y, J Peng et al. Assessing urban landscape ecological risk through an adaptive cycle framework. Landscape and Urban Planning, 180, 125-134(2018).
[24] M Martin D, M Mazzotta, J Bousquin. Combining ecosystem services assessment with structured decision making to support ecological restoration planning. Environmental Management, 62, 608-618(2018).
[25] H McRae B, P Beier. Circuit theory predicts gene flow in plant and animal populations. Proceedings of the National Academy of Sciences, 104, 19885-19890(2007).
[26] H McRae B, G Dickson B, H Keitt T et al. Using circuit theory to model connectivity in ecology, evolution and conservation. Ecology, 89, 2712-2724(2008).
[27] M Nunes D, A Tomé, D Pinheiro M. Urban-centric resilience in search of theoretical stabilisation? A phased thematic and conceptual review. Journal of Environmental Management, 230, 282-292(2019).
[28] J Peng, L Li H, X Liu Y et al. Identification and optimization of ecological security pattern in Xiong’an New Area. Acta Geographica Sinica, 73, 701-710(2018).
[29] J Peng, X Liu Y, S Wu J et al. Linking ecosystem services and landscape patterns to assess urban ecosystem health: A case study in Shenzhen City, China. Landscape and Urban Planning, 143, 56-68(2015).
[31] D Roopnarine P, G Byars, P Fitzgerald. Anagenetic evolution, stratophenetic patterns, and random walk models. Paleobiology, 25, 41-57(1999).
[32] F Spear S, N Balkenhol, J Fortin M et al. Use of resistance surfaces for landscape genetic studies: Considerations for parameterization and analysis. Molecular Ecology, 19, 3576-3591(2010).
[33] K Thulasiraman, M Yadav, K Naik. Network science meets circuit theory: Resistance distance, Kirchhoff index, and Foster’s theorems with generalizations and unification. IEEE Transactions on Circuits and Systems I: Regular Papers, 66, 1090-1103(2019).
[39] D Zhou, C Xu J, L Wang et al. Assessing urbanization quality using structure and function analyses: A case study of the urban agglomeration around Hangzhou Bay (UAHB), China. Habitat International, 49, 165-176(2015).


Set citation alerts for the article
Please enter your email address

© Copyright 2018-2021 | Chinese Laser Press. All Rights Reserved 沪ICP备15018463号-20