
Kun ZHENG, Yongchun LUO, Anqiang DENG, Yang YANG, Haiming ZHANG. Microstructure and Electrochemical Property of A2B7-type La0.3Y0.7Ni3.4-xMnxAl0.1 Hydrogen Storage Alloys [J]. Journal of Inorganic Materials, 2020, 35(5): 549
- Journal of Inorganic Materials
- Vol. 35, Issue 5, 549 (2020)
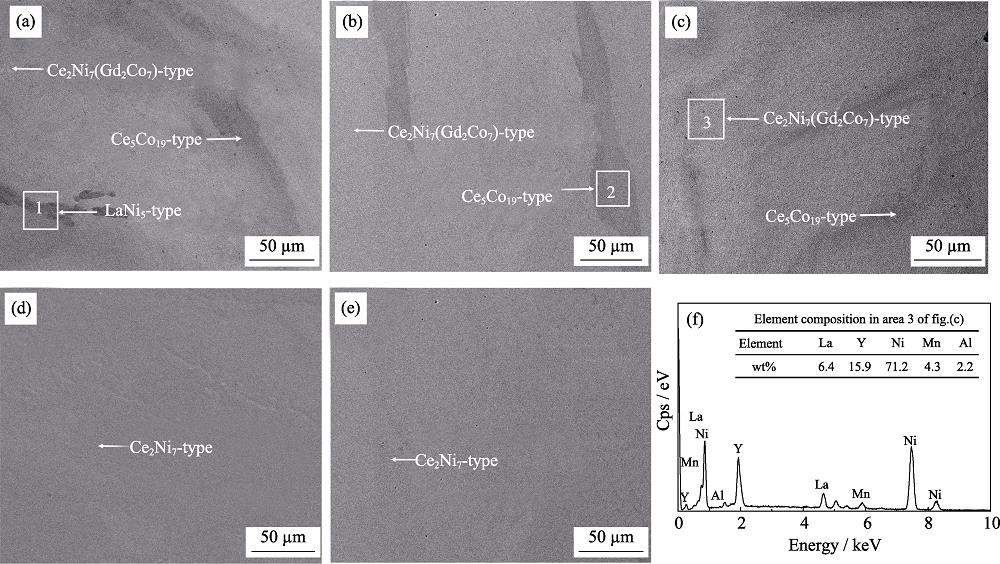
1. SEM images of the annealed alloys (a-e) and EDS pattern of A2B7-type phase in area 3
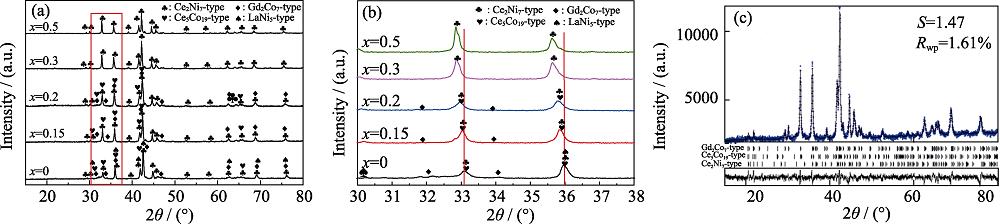
2. XRD patterns (a) and local enlarge XRD patterns (b) of the annealed alloys (a, b) and Rietveld refinement XRD profile of the sample x =0.15(c)
3. Phase structure and phase abundances of the annealed alloys
4. Lattice parameters (a, c ), c/a ratio and (insert)cell volume, V of Ce2Ni7 type phase for the annealed alloys
5. PCT curves and (insert) the relationships between plateau pressure, cell volume and Mn content of the alloys at 300 K
6. lnP eq -1/T plots of the annealed alloys
7. Activation and (insert) discharge potential curves of the alloy electrodes
8. Electrochemical cycling curves and (insert) the relationshipsbetween S 100, discharge capacity and Mn content of the alloy electrodes
9. XRD patterns of the alloy electrodes after 100 electrochemical cycles
10. SEM images of the alloy electrodes after 100 electrochemical cycles
11. Total XPS spectrum (a) and high resolution La3d(b) and Y3d(c) XPS spectra of the alloy electrodes after 100 electrochemical cycles
12. Tafel polarization curves and (insert) the relationshipsbetween E corr, I corr and Mn content of the alloy electrodes
13. High rate discharge ability of the alloy electrodes
14. Relationships between I 0, D 0 and Mn content x
| |||||||||||||||||||||||||||||||||||||||||||||||
Table 1. Elements content of the annealed alloys by ICP analysis


Set citation alerts for the article
Please enter your email address

© Copyright 2018-2021 | Chinese Laser Press. All Rights Reserved 沪ICP备15018463号-20