
Shijie Deng, Haiyan Wang, An Xu, Chunqing Gao, Junbing Li. Target Detection Method Based on Antigrowth[J]. Acta Optica Sinica, 2022, 42(2): 0210002
- Acta Optica Sinica
- Vol. 42, Issue 2, 0210002 (2022)
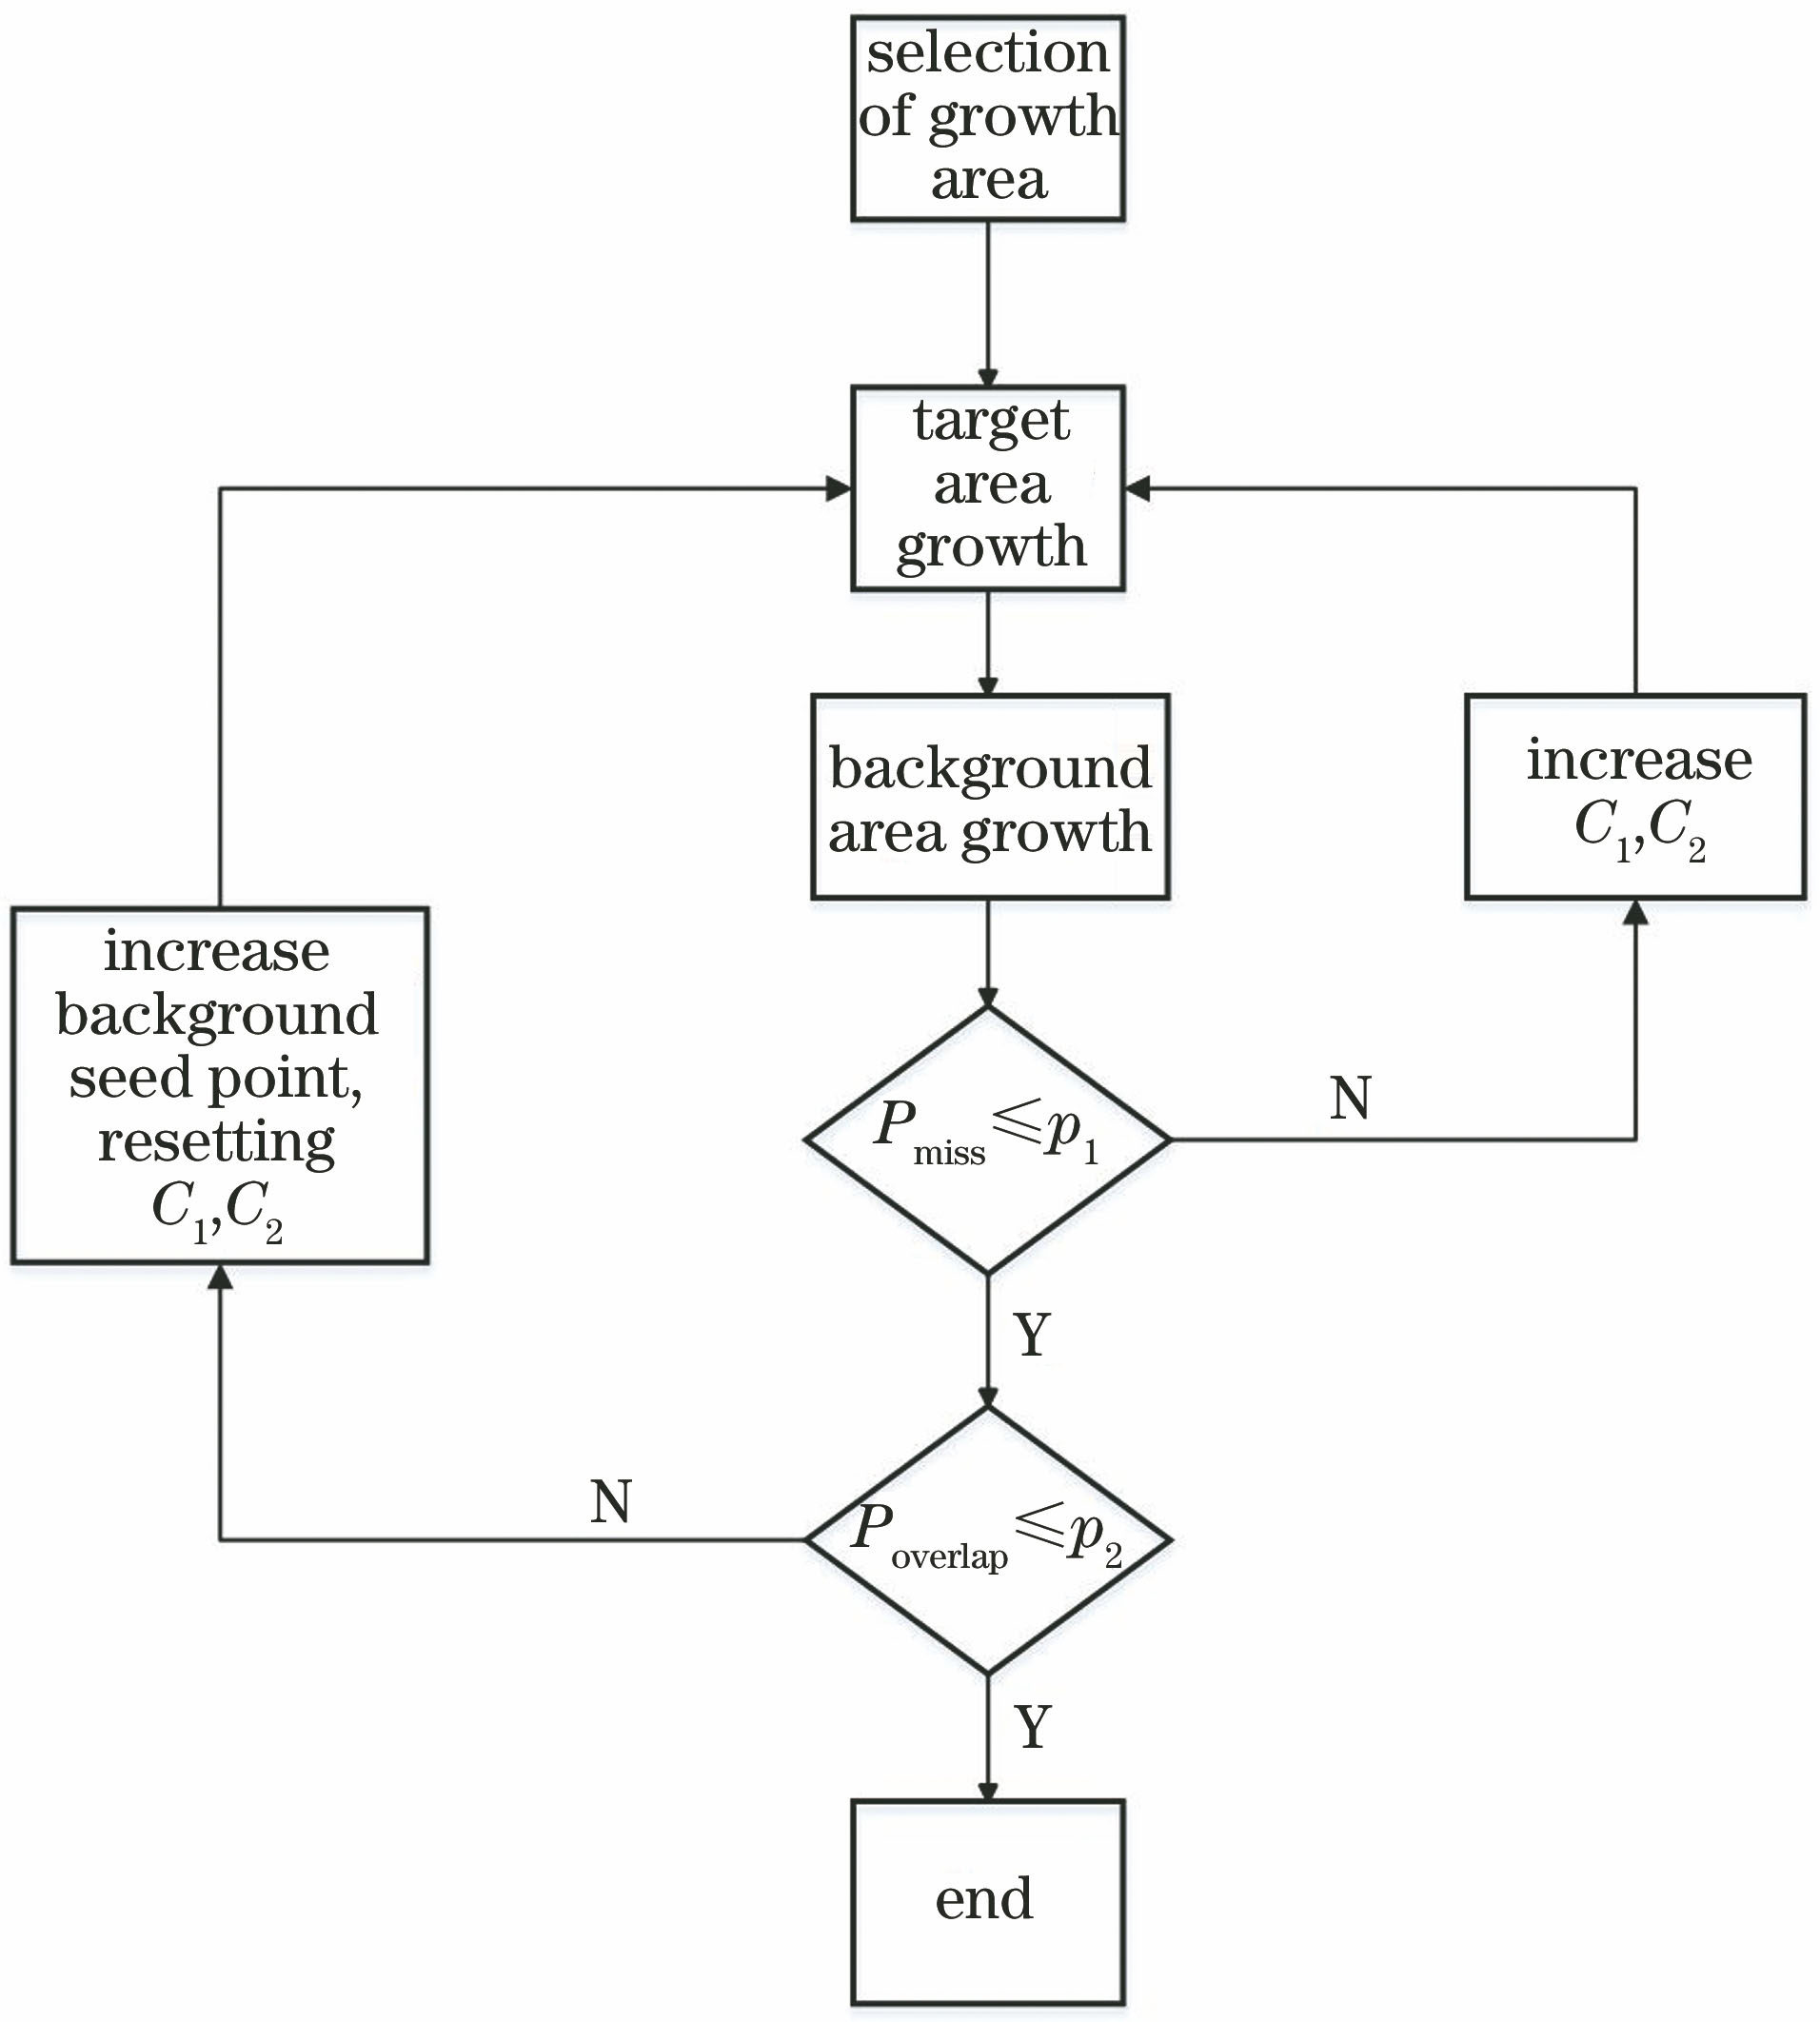
Fig. 1. Flow of proposed algorithm
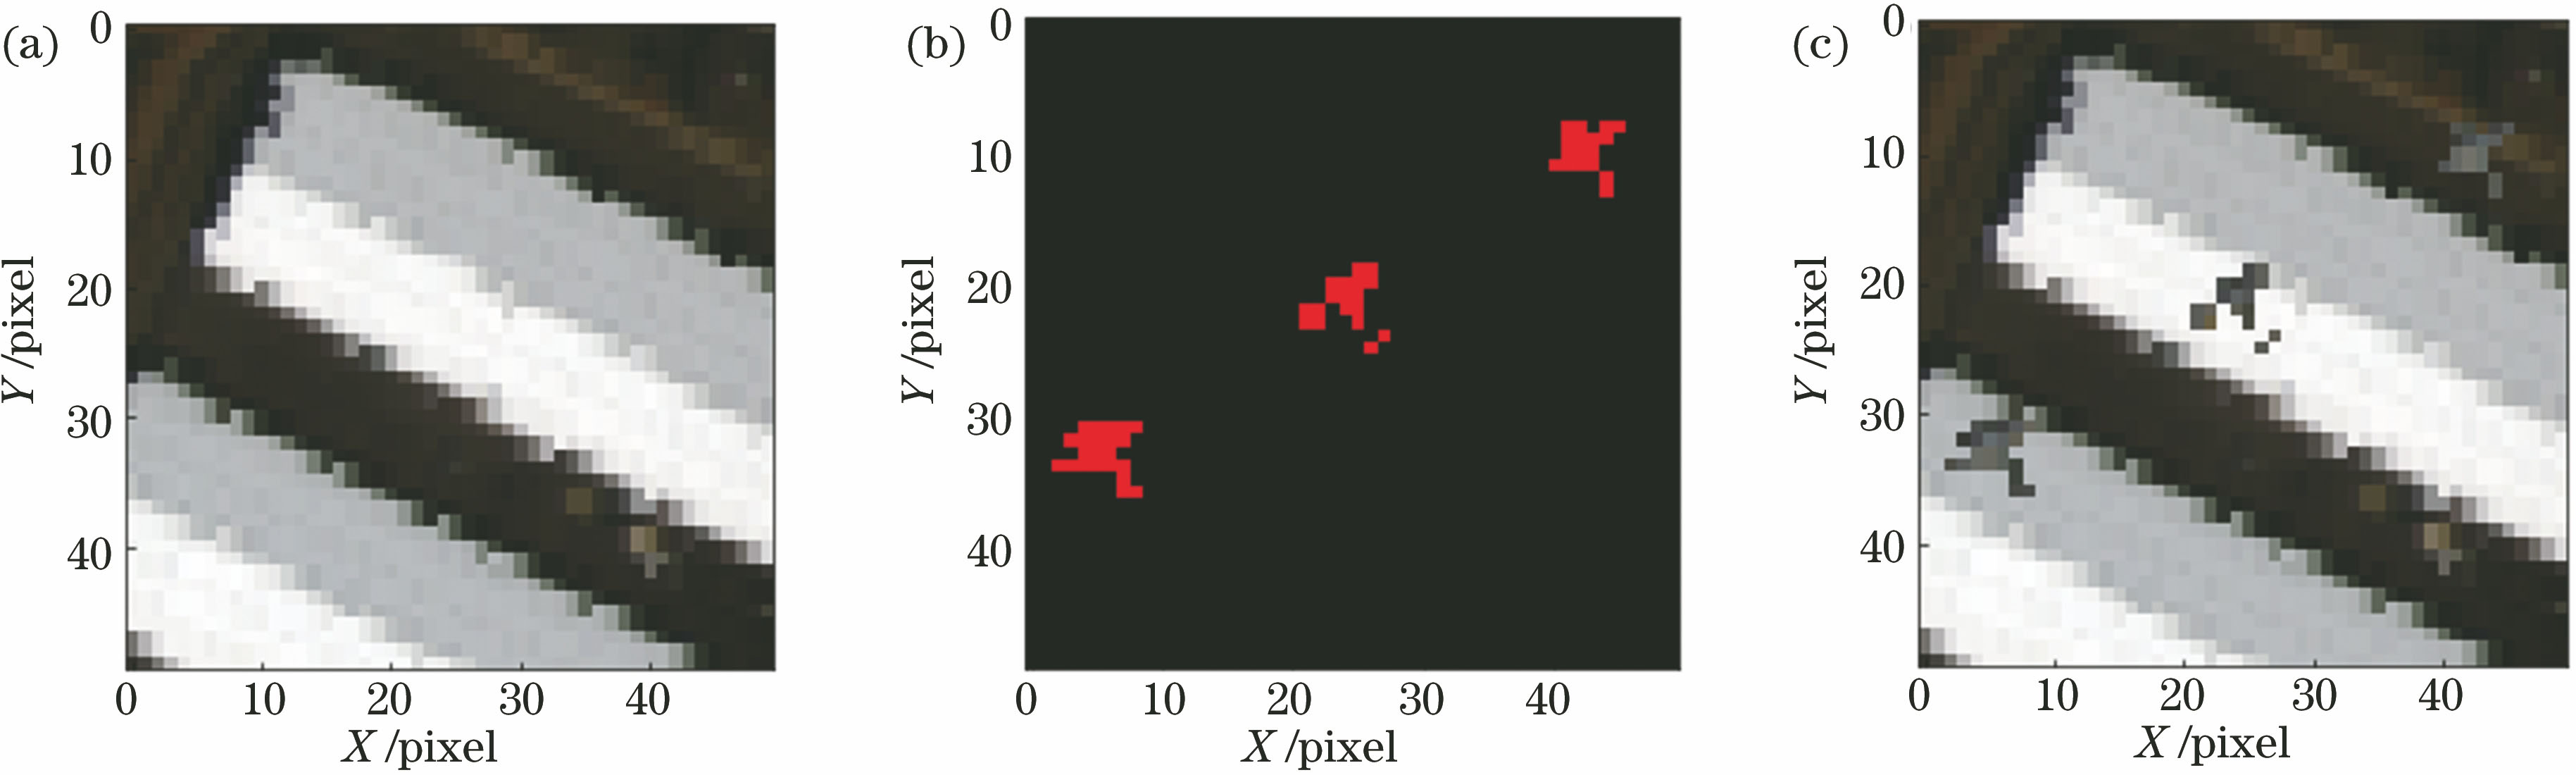
Fig. 2. Experimental data. (a) Original image; (b) objectives; (c) synthesis of data
Fig. 3. Detection effects of different algorithms at different thresholds. (a)--(c) SAM algorithm; (d) proposed algorithm
Fig. 4. Time complexity of proposed algorithm under different initial number of points
Fig. 5. Target growth process. (a) 1st layer; (b) 2nd layer; (c) 3rd layer; (d) 4th layer; (e) dentification result
Fig. 6. Root node optimization process. (a) Short chain growth result; (b) adjacent frequency
Fig. 7. Background growth process. (a) 1st layer; (b) 2nd layer; (c) 3rd layer; (d) 4th layer; (e) against result
Fig. 8. Position of missing and overlapping pixels and final recognition effect. (a) Comprehensive display effect; (b) missing pixels; (c) overlapping pixels; (d) determination effect
Fig. 9. Detection effects of different algorithms. (a) Original images; (b) truth ground; (c) CEM algorithm; (d) ACE algorithm; (e) WCM-OSP algorithm; (f) DERSG algorithm; (g) AG algorithm
Fig. 10. ROCs of different algorithms under different datasets. (a) Data 1; (b) data 2; (c) data 3; (d) data 4
|
Table 1. Detection probability and false alarm probability of different algorithms
|
Table 2. Detection probability and false alarm rate of different algorithms when detection probability is 90%
|
Table 3. Average running time of different algorithms when detection probability is 90%

Set citation alerts for the article
Please enter your email address
© Copyright 2018-2021 | Chinese Laser Press. All Rights Reserved 沪ICP备15018463号-20