• Journal of Resources and Ecology
  • Vol. 11, Issue 6, 580 (2020)
Xue WANG1、* and Xiubin LI1、2
Author Affiliations
  • 1Key Laboratory of Land Surface Pattern and Simulation, Institute of Geographic Sciences and Natural Resources Research, Chinese Academy of Sciences, Beijing 100101, China
  • 2College of Resources and Environment, University of Chinese Academy of Sciences, Beijing 100190, China
  • show less
    DOI: 10.5814/j.issn.1674-764x.2020.06.005 Cite this Article
    Xue WANG, Xiubin LI. Impacts of Land Fragmentation and Cropping System on the Productivity and Efficiency of Grain Producers in the North China Plain: Taking Cangxian County of Hebei Province as an Example[J]. Journal of Resources and Ecology, 2020, 11(6): 580 Copy Citation Text show less
    Location of the case study area
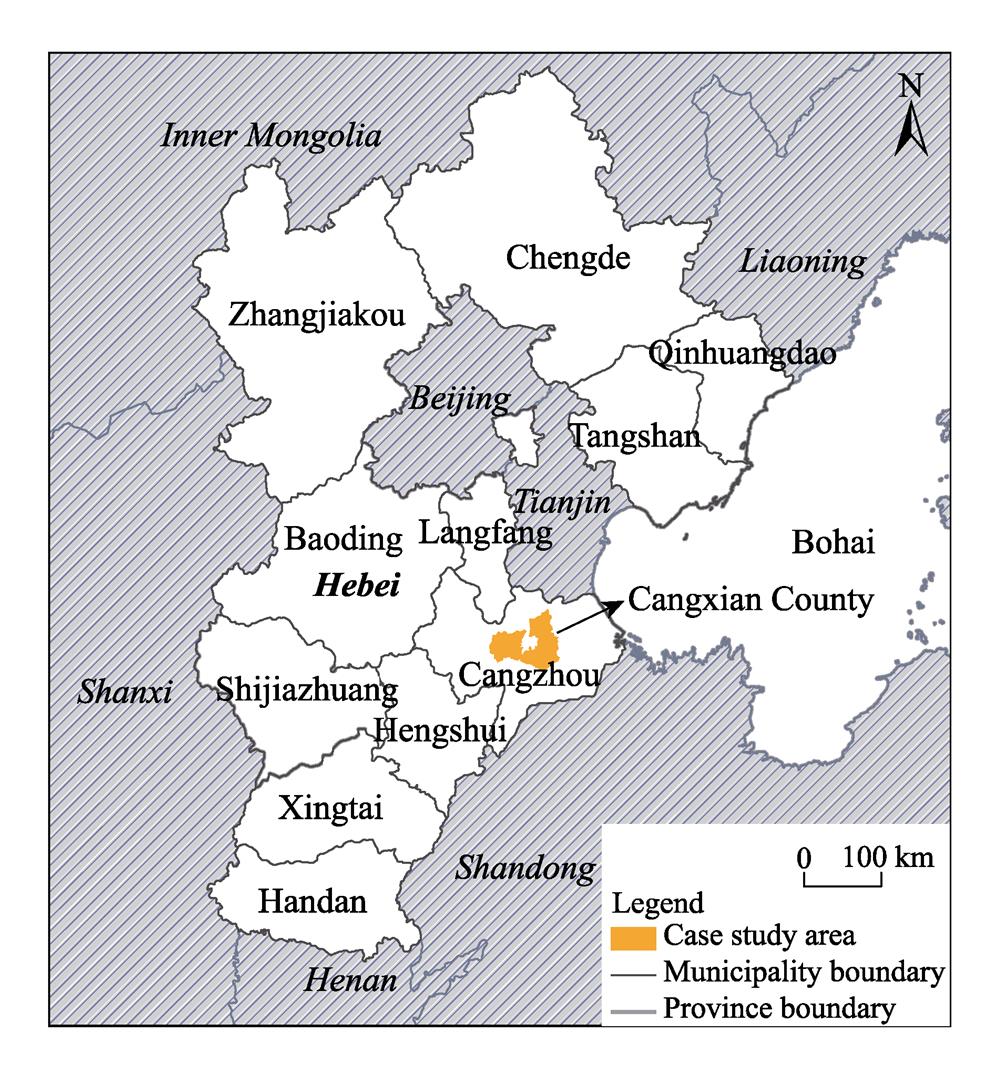
    Fig. 1. Location of the case study area
    Description of the technical efficiency (TE)
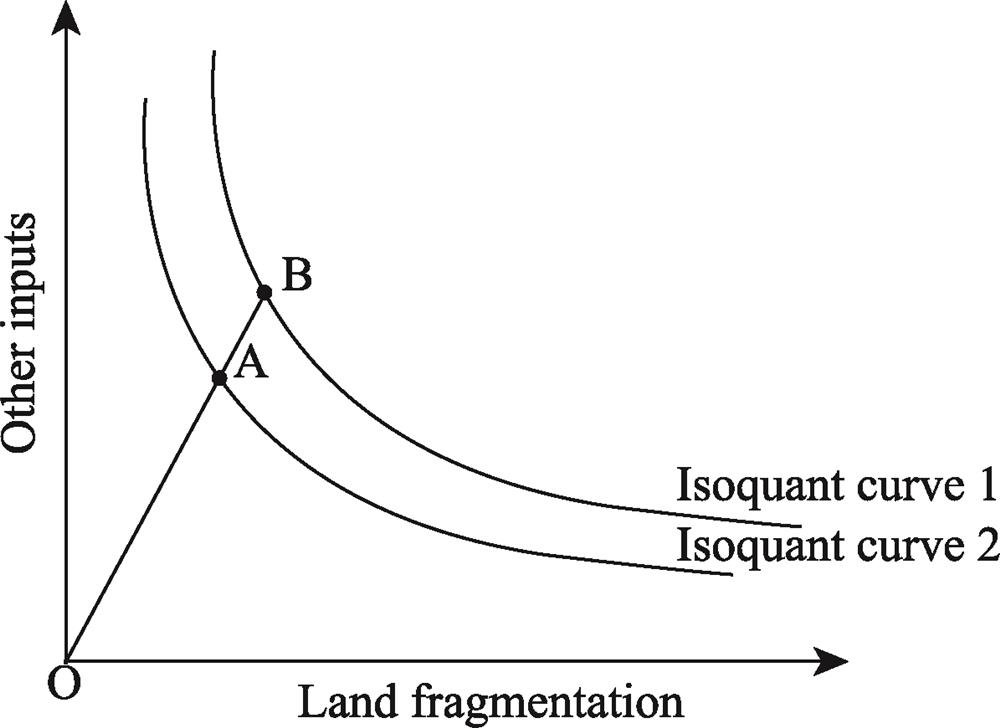
    Fig. 2. Description of the technical efficiency (TE)
    VariableDescriptionMeanS.D.Min.Max.
    Grain outputPer hectare grain output of the household (kg ha-1)7371.003701.68750.0020250.00
    LaborPer hectare input of family labor (person-day ha-1)31.8019.833.00123.96
    SeedPer hectare cost of seed (yuan ha-1)1437.42790.62197.376800.00
    MachineryPer hectare cost of machinery (yuan ha-1)3340.38766.44900.004986.67
    FertilizerPer hectare cost of fertilizer (yuan ha-1)4121.321572.53900.0010016.13
    PesticidePer hectare cost of pesticide (yuan ha-1)209.51231.466.002000.00
    IrrigationPer hectare cost of irrigation (yuan ha-1)518.39484.8830.003290.00
    Irrigation usersDummy (1=Used irrigation, 0=No)0.730.450.001.00
    Average_sizeTotal agricultural land area divided by number of plots (ha)0.160.060.050.40
    MCIMultiple cropping index1.550.371.002.00
    QlandAverage quality of farmland weighted by area2.010.681.004.00
    AgeAge of household head (year)56.9210.5524.0087.00
    EducationEducation status of the household head (1=illiterate; 2=primary school; 3=junior middle school; 4=senior middle school; 5=college or above)2.290.791.005.00
    RagrilaborRatio of agricultural labor to family size0.490.250.101.00
    RoutlaborRatio of off-farm labor to total labor0.350.280.000.83
    AincomeAverage income per off-farm labor (×104 yuan person-1 yr-1)1.240.860.004.56
    Table 1.

    Summary statistics of variables

    VariablesModel 1Model 2Model 3Model 4
    Production frontierCoef.Std. Err.Coef.Std. Err.Coef.Std. Err.Coef.Std. Err.
    ln(Labor)0.197***0.0400.213***0.0390.167***0.0420.175***0.041
    ln(Seed)0.122***0.0320.128***0.0310.098***0.0300.104***0.029
    ln(Machinery)0.1080.166-0.1070.161-0.0690.170-0.0900.167
    ln(Fertilizer)0.0770.0470.0520.0470.0740.0460.0570.045
    ln(Pesticide)-0.020**0.009-0.015*0.008-0.018**0.004-0.015**0.007
    ln(Irrigation)0.009**0.0040.009**0.0040.008***0.0040.007*0.004
    Average_size--0.926***0.224--0.757***0.225
    MCI----0.241***0.0520.229***0.051
    Constant7.120***0.4507.012***0.4097.363***0.4417.326***0.429
    Inefficiency predictors
    Age0.005**0.0020.007*0.0040.007*0.0040.0110.008
    Education-0.0030.0270.0020.0380.0060.0390.0160.058
    Ragrilabor0.1280.1520.1590.2150.1850.2280.2260.065
    Routlabor0.219*0.1150.281*0.1400.308*0.3050.1480.371
    Aincome-0.0290.026-0.0240.035-0.0400.039-0.0340.055
    Qland0.150***0.0380.195***0.0680.211***0.0750.283**0.137
    Average_size-1.521***0.493---1.916***0.776--
    MCI-0.293***0.092-0.381***0.150----
    Constant0.2750.271-0.2760.493-0.6130.564-1.6381.246
    Model diagnostics
    ${{\sigma }^{2}}=\sigma _{\mu }^{2}+\sigma _{v}^{2}$0.077***0.0160.100***0.0320.107***0.0350.148**0.071
    $\gamma =\sigma _{\mu }^{2}/(\sigma _{\mu }^{2}+\sigma _{v}^{2})$0.815***0.0620.834***0.0530.862***0.0490.887***0.049
    H0: No inefficiency component (Prob. ≤ z):
    0.0000.0000.0000.000
    Total number of observations350350350350
    Table 2.

    Parameter estimation results for the Cobb-Douglas production frontier and technical inefficiency models

    VariablesModel 1Model 2Model 3Model 4
    Mean0.7370.7780.7760.802
    S. D.0.1350.1280.1300.124
    Min.0.3300.3520.3690.352
    Max.0.9650.9670.9660.967
    Table 3.

    Technical efficiency (TE) scores

    Xue WANG, Xiubin LI. Impacts of Land Fragmentation and Cropping System on the Productivity and Efficiency of Grain Producers in the North China Plain: Taking Cangxian County of Hebei Province as an Example[J]. Journal of Resources and Ecology, 2020, 11(6): 580
    Download Citation