• Acta Optica Sinica
  • Vol. 38, Issue 8, 0815019 (2018)
Fuzhong Bai1、*, Tieying Zhang2, Xiaojuan Gao1, and Yongxiang Xu1
Author Affiliations
  • 1 College of Mechanical Engineering, Inner Mongolia University of Technology, Huhhot, Inner Mongolia 0 10051, China
  • 2 Chifeng Product Quality and Measurement Inspect Institute, Chifeng, Inner Mongolia 0 24005, China
  • show less
    DOI: 10.3788/AOS201838.0815019 Cite this Article Set citation alerts
    Fuzhong Bai, Tieying Zhang, Xiaojuan Gao, Yongxiang Xu. Local Bending Measurement of Laser Stripe Images Based on Fourier-Polar Transformation[J]. Acta Optica Sinica, 2018, 38(8): 0815019 Copy Citation Text show less
    Translation and rotation characteristics of 2D Fourier transformation. (a) f1; (b) f2; (c) M1; (d) M2
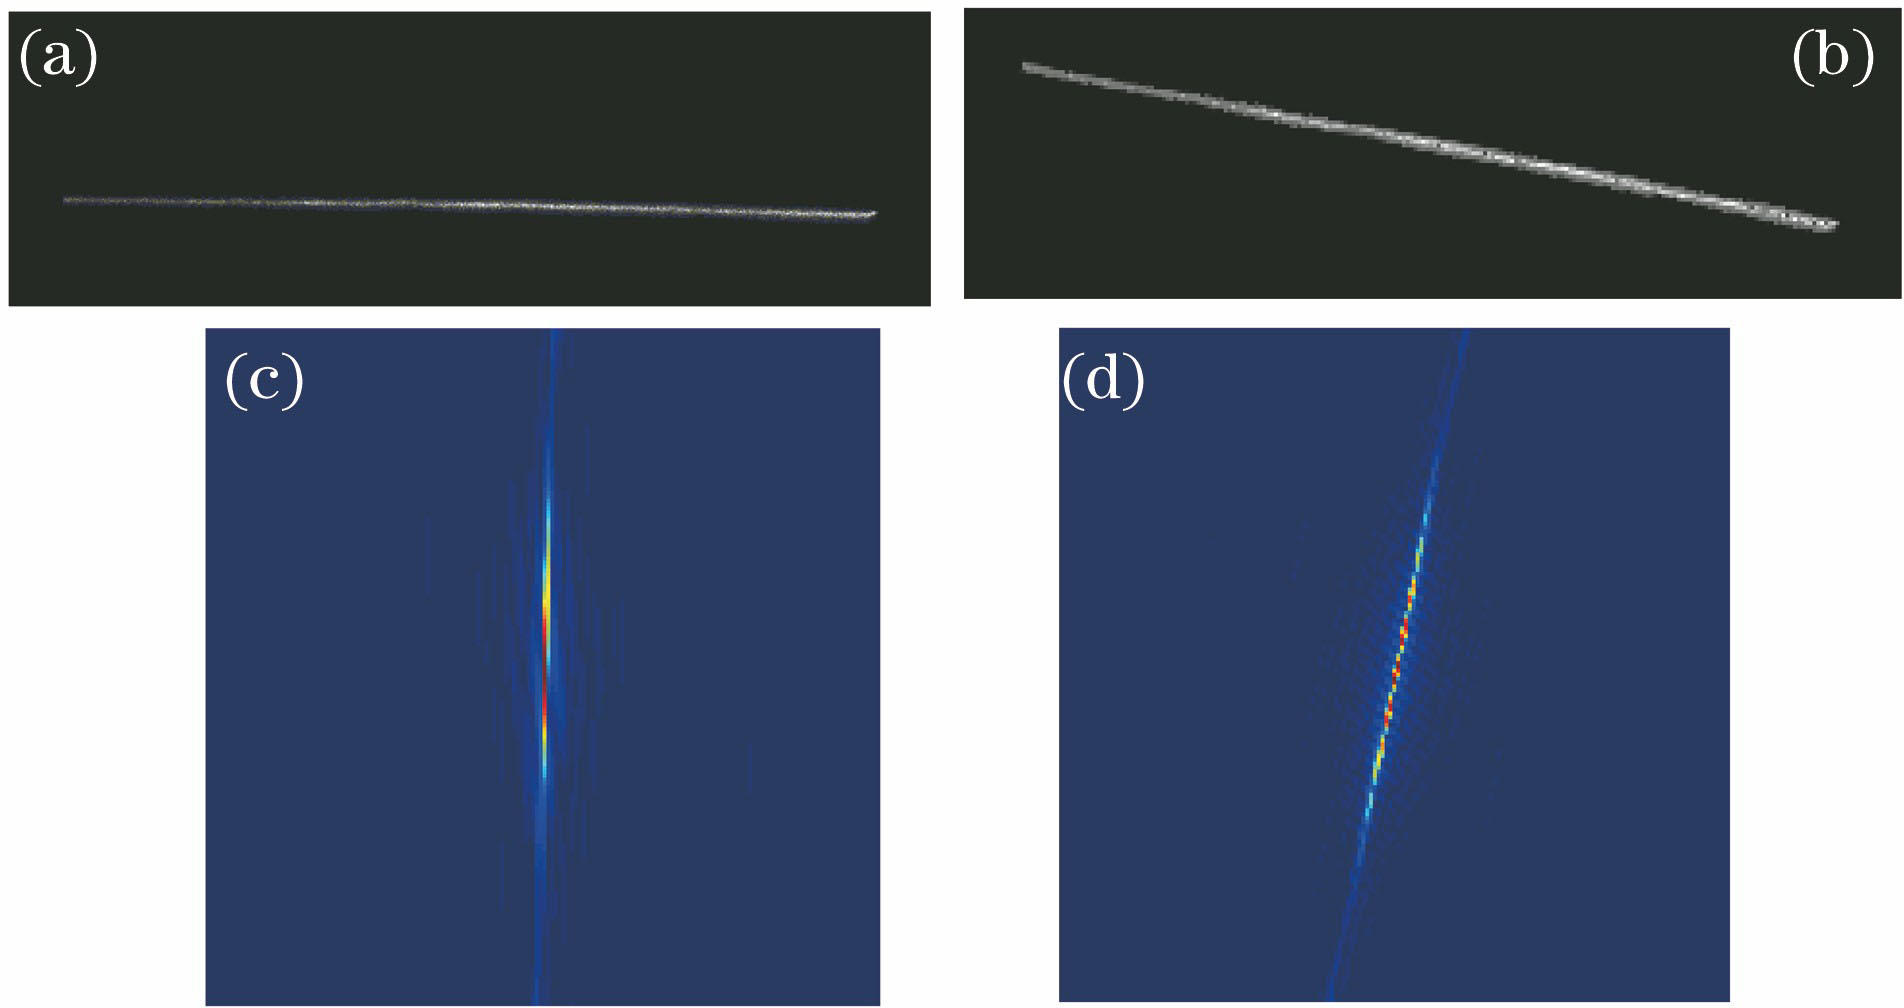
    Fig. 1. Translation and rotation characteristics of 2D Fourier transformation. (a) f1; (b) f2; (c) M1; (d) M2
    Fan-shaped area used to evaluate relationship between energy and angle in magnitude spectrum
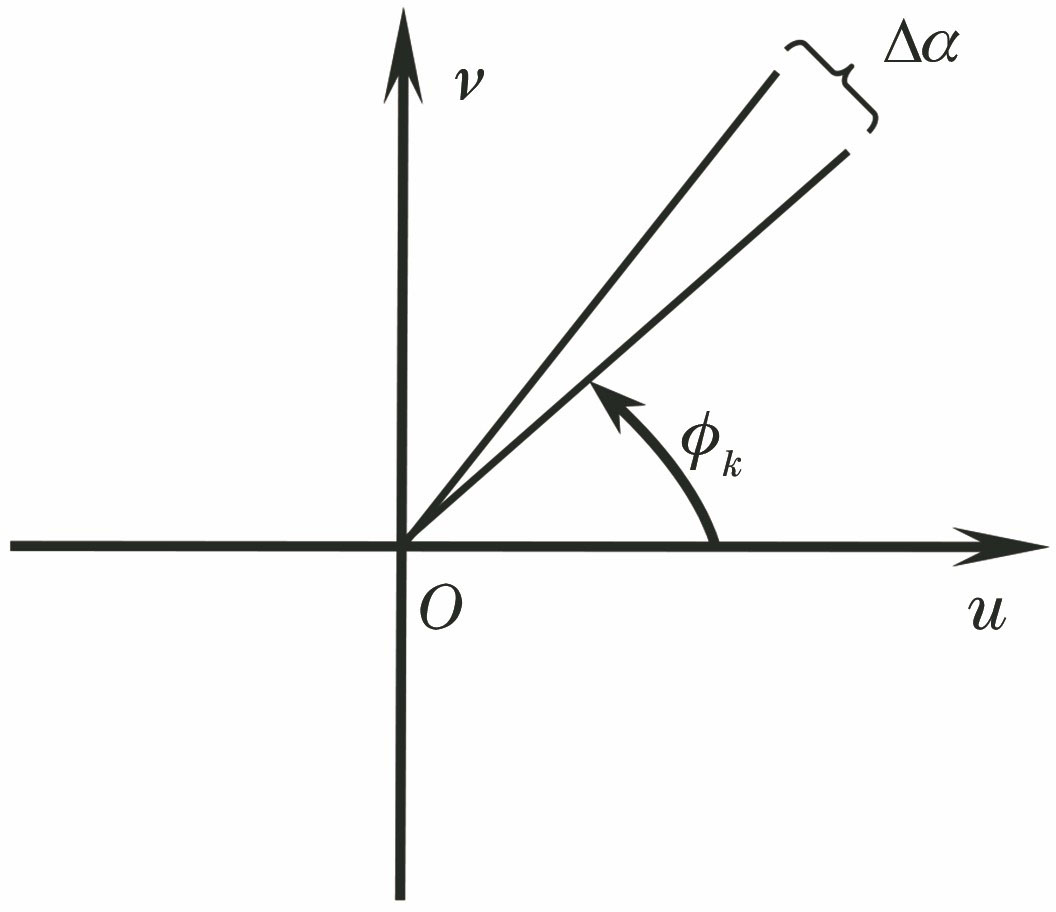
    Fig. 2. Fan-shaped area used to evaluate relationship between energy and angle in magnitude spectrum
    Schematic of polar transformation. (a) Cartesian coordinate; (b) polar coordinate
    Fig. 3. Schematic of polar transformation. (a) Cartesian coordinate; (b) polar coordinate
    Ring-shaped area used for polar transformation
    Fig. 4. Ring-shaped area used for polar transformation
    Polar transformation of magnitude spectra shown in Fig. 1. (a) M1; (b) M2
    Fig. 5. Polar transformation of magnitude spectra shown in Fig. 1. (a) M1; (b) M2
    Energy as a function of angle
    Fig. 6. Energy as a function of angle
    Schematic of directional projection
    Fig. 7. Schematic of directional projection
    Projection curves along normal direction of images shown in Fig.1. (a) f1; (b) f2
    Fig. 8. Projection curves along normal direction of images shown in Fig.1. (a) f1; (b) f2
    Experimental detecting results of local bending of laser stripe images. (a) (b) laser stripe images recorded in experiment; (c) (d) h(?) obtained after Fourier-polar transformation; (e) (f) projection curves of laser stripe images along normal direction
    Fig. 9. Experimental detecting results of local bending of laser stripe images. (a) (b) laser stripe images recorded in experiment; (c) (d) h(?) obtained after Fourier-polar transformation; (e) (f) projection curves of laser stripe images along normal direction
    Experimental results of laser stripe images with local contamination and Gaussian noises. (a) Laser stripe image; (b) Fourier-polar transformation result and h(?); (c) projection curve of laser stripe image along normal direction
    Fig. 10. Experimental results of laser stripe images with local contamination and Gaussian noises. (a) Laser stripe image; (b) Fourier-polar transformation result and h(?); (c) projection curve of laser stripe image along normal direction
    Extracting result of center-line in Fig. 10(a) by gray level gravity algorithm
    Fig. 11. Extracting result of center-line in Fig. 10(a) by gray level gravity algorithm
    Fuzhong Bai, Tieying Zhang, Xiaojuan Gao, Yongxiang Xu. Local Bending Measurement of Laser Stripe Images Based on Fourier-Polar Transformation[J]. Acta Optica Sinica, 2018, 38(8): 0815019
    Download Citation