
Xinchi Rong, Chao Wang, Jiawei Ren, Tao Wang, Yijun Zhu. Visible Light Communication System Based on Embedded Hard Drive Indicator[J]. Acta Optica Sinica, 2020, 40(18): 1806004
- Acta Optica Sinica
- Vol. 40, Issue 18, 1806004 (2020)
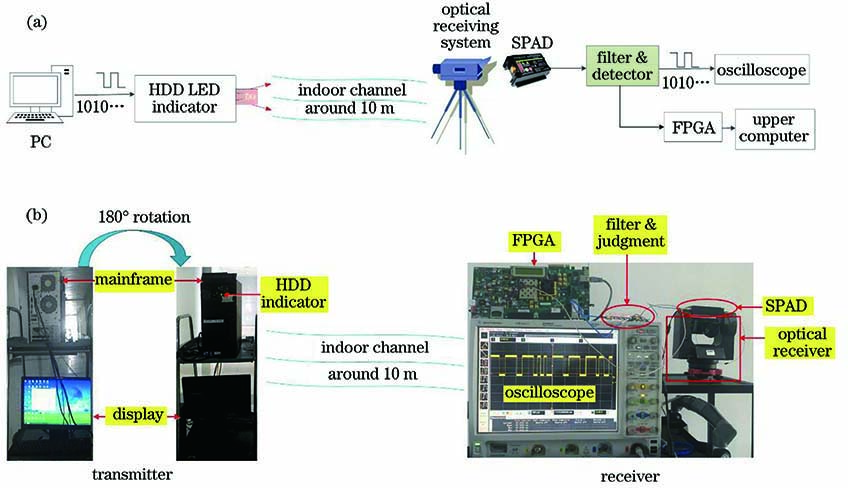
Fig. 1. Experimental system of SPAD-VLC based on HDD indicator. (a) Schematic of experiment; (b) schematic of experimental link
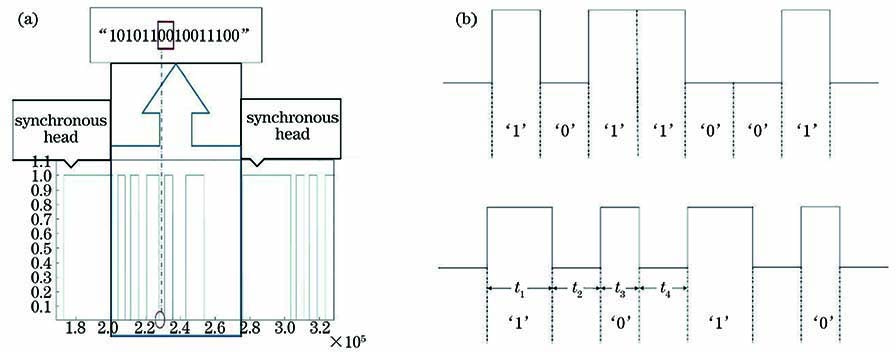
Fig. 2. Comparison between traditional OOK modulation and PWLSK modulation. (a) Schematic of clock drift; (b) schematic of waveform
Fig. 3. Flow chart of signal generation process
Fig. 4. Statistical results of signal parameters. (a) Linearity analysis for data block size and mean time; (b) distribution fitting of data block with size of 4 Kbit
Fig. 5. Actual waveform modulated by PWLSK
Fig. 6. Mean value and variance value of photons. (a) Mean value; (b) variance value
Fig. 7. Average data rate and BER of each data block selection scheme
Fig. 8. Performance comparison between OOK scheme and PWLSK scheme
Fig. 9. BER of PWLSK scheme and OOK scheme under different λ0
Fig. 10. Achievement exhibiting of terminal interface. (a) Sending terminal; (b) receiving terminal
|
Table 1. Corresponding time of system operations
|
Table 2. Statistical result of time required for reading data blocks with different sizes
|
Table 3. Simulated BER and experimental BER of PWLSK scheme

Set citation alerts for the article
Please enter your email address
© Copyright 2018-2021 | Chinese Laser Press. All Rights Reserved 沪ICP备15018463号-20