
Heng LUO, Hsitien Shen Andy. Based on Color Calculation and In-Situ Element Analyze to Study the Color Origin of Purple Chalcedony[J]. Spectroscopy and Spectral Analysis, 2022, 42(6): 1891
- Spectroscopy and Spectral Analysis
- Vol. 42, Issue 6, 1891 (2022)
![Image of purple grape chalcedony(a)—(d): Rough stone of grape chalcedony (illuminant 6 500 K); (e)—(h): Chalcedony double sides polishing wafer under the same illuminant (5 500 K), with different lighting methods [(e), (g) are the top lighting, (f), (h) are the bottom lighting], the red dots are the points of component analysis by LA-ICP-MS](/richHtml/gpxygpfx/2022/42/6/1891/img_1.png)
Fig. 1. Image of purple grape chalcedony
(a)—(d): Rough stone of grape chalcedony (illuminant 6 500 K); (e)—(h): Chalcedony double sides polishing wafer under the same illuminant (5 500 K), with different lighting methods [(e), (g) are the top lighting, (f), (h) are the bottom lighting], the red dots are the points of component analysis by LA-ICP-MS
(a)—(d): Rough stone of grape chalcedony (illuminant 6 500 K); (e)—(h): Chalcedony double sides polishing wafer under the same illuminant (5 500 K), with different lighting methods [(e), (g) are the top lighting, (f), (h) are the bottom lighting], the red dots are the points of component analysis by LA-ICP-MS
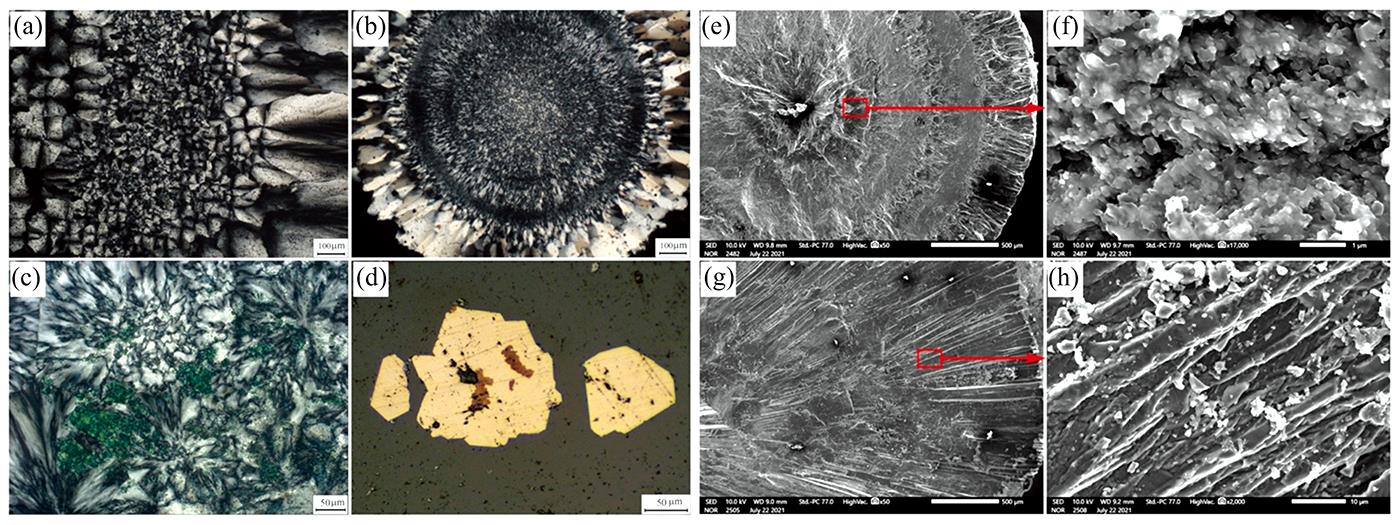
Fig. 2. Microphotographs and scanning electron microscope images of grape chalcedony
(a)—(d): Microscopic characteristics of grape chalcedony, (a), (b), (c) are transmitted light (CPL), (d) is reflected light illuminate in dark field; (e)—(h): Morphological characteristics of chalcedony fracture by SEM, (f), (h) are partial enlarged detail of (e) and (g), respectively
(a)—(d): Microscopic characteristics of grape chalcedony, (a), (b), (c) are transmitted light (CPL), (d) is reflected light illuminate in dark field; (e)—(h): Morphological characteristics of chalcedony fracture by SEM, (f), (h) are partial enlarged detail of (e) and (g), respectively
Fig. 3. UV-Vis spectrum of purple chalcedony
Fig. 4. Modified UV-Vis spectrum of purple chalcedony and color of photo or calculate
(a): UV-Vis spectra of sample 1; (b): The photo of sample 1 with transmitted light, and the color of photo and calculated; (c): The photo of sample 1 with reflected illumination, and the color of photo and calculated; (d): UV-Vis spectra of sample 1 after baseline correction; (e): UV-Vis spectra of sample 2; (f): The photo of sample 2 with transmitted light, and the color of photo and calculated; (g): The photo of sample 2 with reflected illumination, and the color of photo and calculated; (h): UV-Vis spectra of sample 2 after baseline correction
(a): UV-Vis spectra of sample 1; (b): The photo of sample 1 with transmitted light, and the color of photo and calculated; (c): The photo of sample 1 with reflected illumination, and the color of photo and calculated; (d): UV-Vis spectra of sample 1 after baseline correction; (e): UV-Vis spectra of sample 2; (f): The photo of sample 2 with transmitted light, and the color of photo and calculated; (g): The photo of sample 2 with reflected illumination, and the color of photo and calculated; (h): UV-Vis spectra of sample 2 after baseline correction
Fig. 5. Color and spectral changes of purple chalcedony during heat treatment
(a): Color change before (left) and after (right) heat treatment; (b): The photo of chalcedony wafer at 25, 350, 400 and 500 ℃; (c): UV-Vis spectra of chalcedony at 25, 350, 400 and 500 ℃; (d): The color of photo and calculated of sample 2 after 500 ℃ heat treatment
(a): Color change before (left) and after (right) heat treatment; (b): The photo of chalcedony wafer at 25, 350, 400 and 500 ℃; (c): UV-Vis spectra of chalcedony at 25, 350, 400 and 500 ℃; (d): The color of photo and calculated of sample 2 after 500 ℃ heat treatment
Fig. 6. Normalized E * value—scatter plot of element content
(a)—(d): Scatter diagram ofE * value of chalcedony purple color refer to 540 nm Peak and content of transition metal elements;(e)—(h): Scatter diagram of E * value of chalcedony Yellow color refer totransition metal elements
(a)—(d): Scatter diagram of
|
Table 1. Transition metal elements content (ppmw) of some test points

Set citation alerts for the article
Please enter your email address
© Copyright 2018-2021 | Chinese Laser Press. All Rights Reserved 沪ICP备15018463号-20