• Journal of Inorganic Materials
  • Vol. 35, Issue 5, 556 (2020)
Xiong ZHOU1, Lizhi FANG1, Shuangwu HUANG1, Haiping XIA1、*, Jianxu HU1, Jianli ZHANG1, and Baojiu CHEN2
Author Affiliations
  • 1Key Laboratory of Photo-electronic Materials, Ningbo University, Ningbo 315211, China
  • 2Department of Physics, Dalian Maritime University, Dalian 116026, China
  • show less
    DOI: 10.15541/jim20190215 Cite this Article
    Xiong ZHOU, Lizhi FANG, Shuangwu HUANG, Haiping XIA, Jianxu HU, Jianli ZHANG, Baojiu CHEN. Ultraviolet and Near-infrared Luminescence of Ce 3+/Yb 3+ Co-doping LiLuF4 Single Crystal [J]. Journal of Inorganic Materials, 2020, 35(5): 556 Copy Citation Text show less
    (a) Photo of the grown single crystal; (b) XRD patterns of C0, CY3 and standard card of LiLuF4
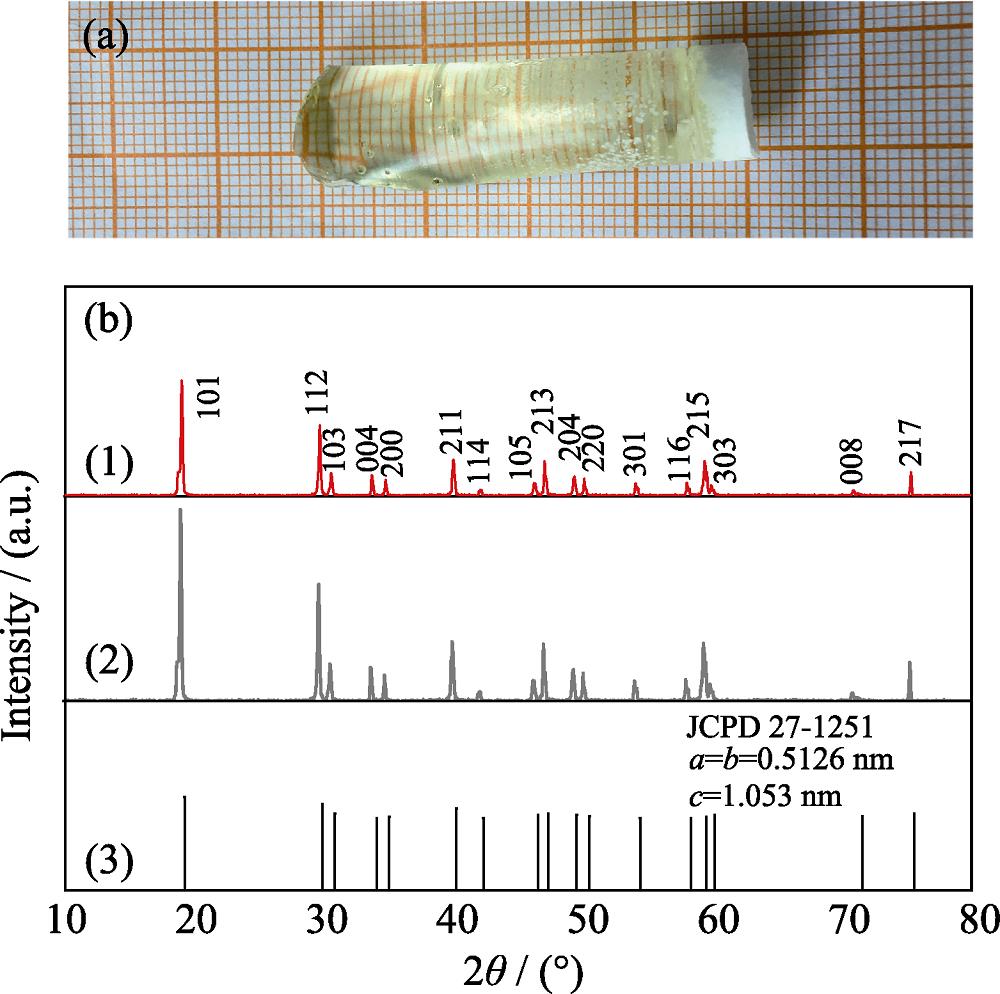
    1. (a) Photo of the grown single crystal; (b) XRD patterns of C0, CY3 and standard card of LiLuF4
    (a) Crystal structure of LiLuF4, and (b) coordination for lithium and (c) lutetium sites
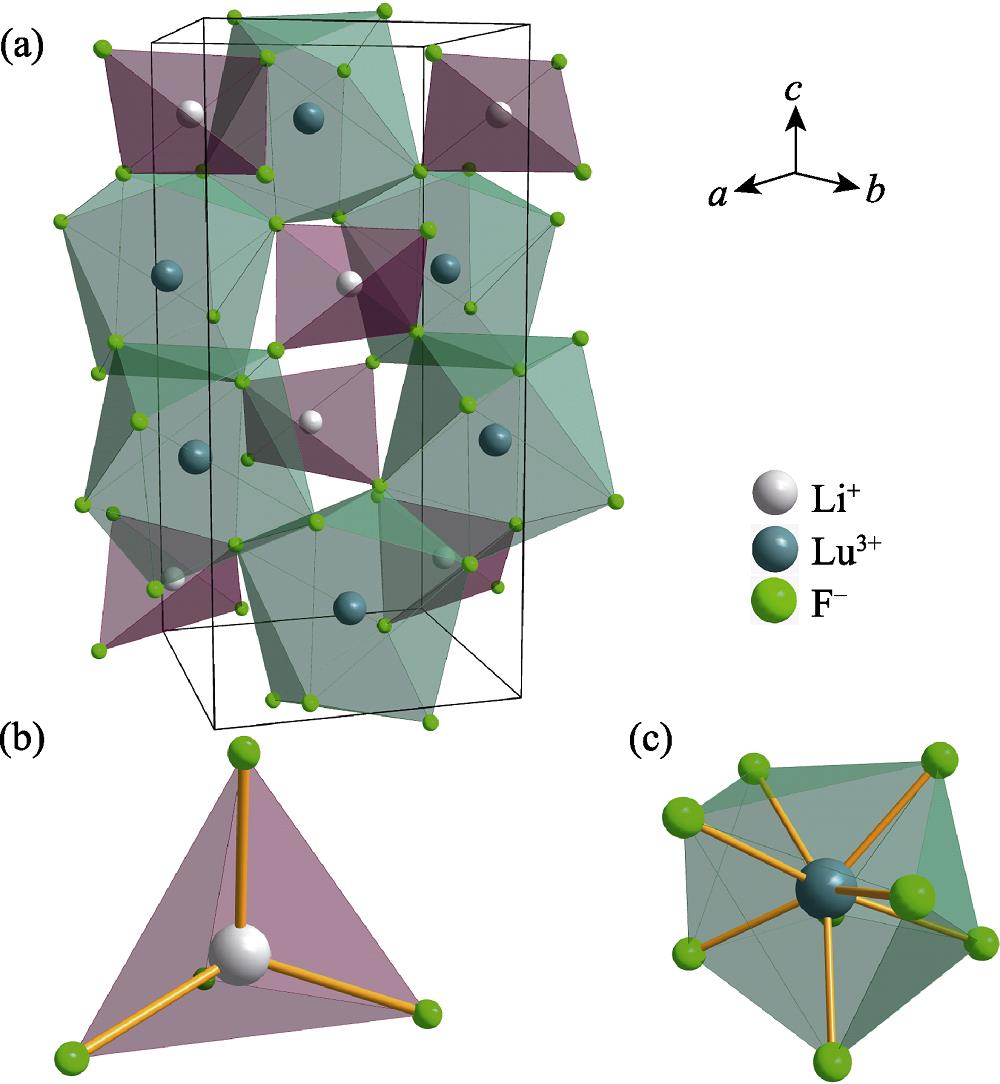
    2. (a) Crystal structure of LiLuF4, and (b) coordination for lithium and (c) lutetium sites
    Absorption spectra of the LiLuF4 single crystals
    3. Absorption spectra of the LiLuF4 single crystals
    (a) Emission spectra of Ce3+/Yb3+ co-doped LiLuF4 single crystals excited at 291 nm, and (b) emission intensity of Ce3+ and Yb3+ ions as a function of Yb3+ concentration
    4. (a) Emission spectra of Ce3+/Yb3+ co-doped LiLuF4 single crystals excited at 291 nm, and (b) emission intensity of Ce3+ and Yb3+ ions as a function of Yb3+ concentration
    Partial energy level diagram in Ce3+/Yb3+ co-doped LiLuF4 single crystal
    5. Partial energy level diagram in Ce3+/Yb3+ co-doped LiLuF4 single crystal
    (a) Fluorescence decay curves of active Ce3+ ions near 326 nm in Ce3+ singly doped LiLuF4 single crystal; (b) Fitting curves with Inokuti-Hirayama model
    6. (a) Fluorescence decay curves of active Ce3+ ions near 326 nm in Ce3+ singly doped LiLuF4 single crystal; (b) Fitting curves with Inokuti-Hirayama model
    (a) Temperature dependent emission spectra of 0.1mol% Ce3+/1.5mol% Yb3+ sample under 291 nm excitation, and (b) emission intensity of Ce3+ and Yb3+ as a function of temperature
    7. (a) Temperature dependent emission spectra of 0.1mol% Ce3+/1.5mol% Yb3+ sample under 291 nm excitation, and (b) emission intensity of Ce3+ and Yb3+ as a function of temperature
    SampleC0CY1CY2CY3CY4
    Ce3+ in raw material/mol%0.10.10.10.10.1
    Ce3+ molar concentration in crystal/mol%0.0230.0220.0240.0220.024
    Ce3+ measured in crystal/(×1020, ions·cm-1)0.0230.0220.0240.0220.024
    Yb3+ in raw material/mol%00.51.01.52.0
    Yb3+ molar concentration in crystal/mol%00.4990.9871.4861.982
    Yb3+ measured in crystal/(×1020, ions·cm-1)00.5020.9931.4951.994
    Table 1. Molar fractions of Ce3+ and Yb3+ in raw materials and the number of Ce3+ ions (N) and Yb3+ ions in single crystals
    Xiong ZHOU, Lizhi FANG, Shuangwu HUANG, Haiping XIA, Jianxu HU, Jianli ZHANG, Baojiu CHEN. Ultraviolet and Near-infrared Luminescence of Ce 3+/Yb 3+ Co-doping LiLuF4 Single Crystal [J]. Journal of Inorganic Materials, 2020, 35(5): 556
    Download Citation