• Acta Optica Sinica
  • Vol. 42, Issue 16, 1624001 (2022)
Xiangmin Huang, Hui Shi, Hang Zhao, Jun Ma, and Xiaofeng Shi*
Author Affiliations
  • Key Laboratory of Optics & Optoelectronics, Ocean University of China, Qingdao 266100, Shandong , China
  • show less
    DOI: 10.3788/AOS202242.1624001 Cite this Article Set citation alerts
    Xiangmin Huang, Hui Shi, Hang Zhao, Jun Ma, Xiaofeng Shi. Capture and SERS Detection of Nano Plastics Based on Photothermal Effect[J]. Acta Optica Sinica, 2022, 42(16): 1624001 Copy Citation Text show less
    Diagram of optical manipulation microscopic Raman system
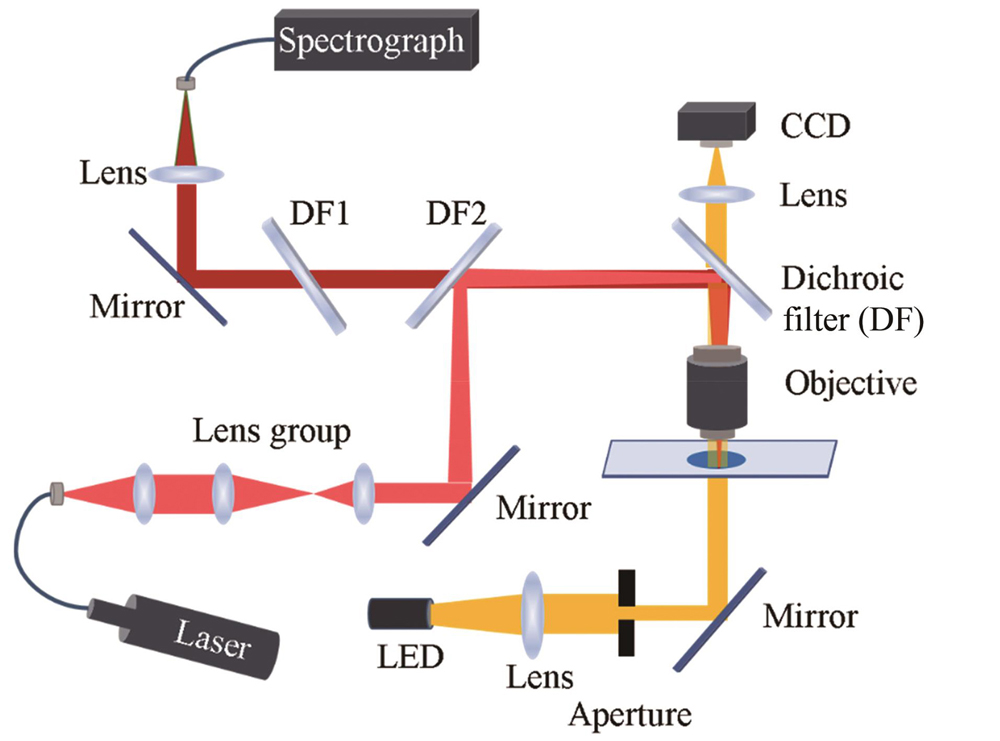
    Fig. 1. Diagram of optical manipulation microscopic Raman system
    SEM images of experimental materials. (a) PS nanoparticles; (b) gold nanoparticles; (c) gold nanoparticle aggregates
    Fig. 2. SEM images of experimental materials. (a) PS nanoparticles; (b) gold nanoparticles; (c) gold nanoparticle aggregates
    Photographs of PS nanoparticles and gold nanoparticles. (a)(b) Morphologies of PS nanoparticles in field of view plane and out of field of view plane; (c)(d) morphologies of gold nanoparticles in field of view plane and out of field of view plane
    Fig. 3. Photographs of PS nanoparticles and gold nanoparticles. (a)(b) Morphologies of PS nanoparticles in field of view plane and out of field of view plane; (c)(d) morphologies of gold nanoparticles in field of view plane and out of field of view plane
    Photographs of PS nanoparticles under different environmental conditions. (a)-(d) Photos of PS nanoparticles at different time points when there are only PS nanoparticles in solution; (e)-(h) photos of PS nanoparticles at different time points in mixed fluid of gold nanoparticles and PS nanoparticles
    Fig. 4. Photographs of PS nanoparticles under different environmental conditions. (a)-(d) Photos of PS nanoparticles at different time points when there are only PS nanoparticles in solution; (e)-(h) photos of PS nanoparticles at different time points in mixed fluid of gold nanoparticles and PS nanoparticles
    Distributions of motion velocity of PS nanoparticles. (a) Boxplot of relationship between moving speed of PS nanoparticles and gold particle size distribution; (b) boxplot of relationship between moving speed of PS nanoparticles and gold particle concentration distribution
    Fig. 5. Distributions of motion velocity of PS nanoparticles. (a) Boxplot of relationship between moving speed of PS nanoparticles and gold particle size distribution; (b) boxplot of relationship between moving speed of PS nanoparticles and gold particle concentration distribution
    Curves of SERS signal of PS nanoparticles. (a) Waterfall plot of PS nanoparticle SERS signal with time; (b) curve of Raman peak intensity at 1000 cm-1 with time; (c) SERS spectrum of PS nanoparticles with mass concentration of 10 μg/mL
    Fig. 6. Curves of SERS signal of PS nanoparticles. (a) Waterfall plot of PS nanoparticle SERS signal with time; (b) curve of Raman peak intensity at 1000 cm-1 with time; (c) SERS spectrum of PS nanoparticles with mass concentration of 10 μg/mL
    Raman map of polystyrene nanoparticles. (a) SEM image of stabilized Au-PS aggregates; (b) SERS signal intensity at points i, ii, iii, and iv with Raman shift of 1000 cm-1
    Fig. 7. Raman map of polystyrene nanoparticles. (a) SEM image of stabilized Au-PS aggregates; (b) SERS signal intensity at points i, ii, iii, and iv with Raman shift of 1000 cm-1
    Particle numberDistance at different time

    Distance

    change

    9.22 s10.15 s11.23 s12.28 s
    130.028.527.024.0-6.0
    232.531.530.024.5-8.0
    334.033.530.025.0-9.0
    451.548.547.535.5-16.0
    Table 1. Distance from nanoparticles 1, 2, 3, and 4 to focus position of particles
    Xiangmin Huang, Hui Shi, Hang Zhao, Jun Ma, Xiaofeng Shi. Capture and SERS Detection of Nano Plastics Based on Photothermal Effect[J]. Acta Optica Sinica, 2022, 42(16): 1624001
    Download Citation