Abstract
A woofer–tweeter adaptive optical structured illumination microscope (AOSIM) is presented. By combining a low-spatial-frequency large-stroke deformable mirror (woofer) with a high-spatial-frequency low-stroke deformable mirror (tweeter), we are able to remove both large-amplitude and high-order aberrations. In addition, using the structured illumination method, as compared to widefield microscopy, the AOSIM can accomplish high-resolution imaging and possesses better sectioning capability. The AOSIM was tested by correcting a large aberration from a trial lens in the conjugate plane of the microscope objective aperture. The experimental results show that the AOSIM has a point spread function with an FWHM that is 140 nm wide (using a water immersion objective lens with ) after correcting a large aberration (5.9 μm peak-to-valley wavefront error with 2.05 μm RMS aberration). After structured light illumination is applied, the results show that we are able to resolve two beads that are separated by 145 nm, below the diffraction limit of 235 nm. Furthermore, we demonstrate the application of the AOSIM in the field of bioimaging. The sample under investigation was a green-fluorescent-protein-labeled Drosophila embryo. The aberrations from the refractive index mismatch between the microscope objective, the immersion fluid, the cover slip, and the sample itself are well corrected. Using AOSIM we were able to increase the SNR for our Drosophila embryo sample by .1. INTRODUCTION
Light microscopy plays an important role in various research domains, in particular for bioimaging [1,2], due to its noninvasive properties and compatibility with in vivo imaging. However, three critical limitations often affect the microscope’s performance. One is the well-known diffraction limit, which limits the microscope resolution to about half of the excitation wavelength due to the wave nature of light. The others are depth aberrations and scattering, which are major sources of image degradation, causing a significant loss of resolution and intensity deep into the sample. A major limitation for ballistic photons is the index mismatch between the sample refractive index (RI) and the immersion medium index [3]. In the past decade, many methods that have reached a spatial resolution beyond the diffraction limit have been reported in Refs. [4–6], for example, stimulated emission depletion microscopy [6], photoactivated localization microscopy [4], and structured illumination microscopy (SIM) [7–11]. Among these, SIM, which extracts high-resolution information from aliased raw data in Fourier space, is widely used in bioimaging. The advantages of SIM are that it is compatible with standard dyes and fluorescent proteins and the images are usually taken in widefield mode, so the image acquisition is faster than scanned beam approaches such as confocal and multiphoton microscopy. Concerning the penetration depth, to overcome the poor sectioning properties of linear absorption widefield microscopy, light sheet [12,13], structured illumination (SI) [11,14–16], confocal [2], and multiphoton microscopy [17] have been used. Indeed, as compared to the widefield microscope, the multiphoton microscope is able to image up to 1200 μm deep in samples [18]. However, imaging deep into the sample, the RI mismatch between the objective lens and the sample, and the aberration from the sample itself, often degrades the point spread function (PSF) quality. Instead of having a high-contrast diffraction-limited focal spot, the energy of the light spreads out widely near the focal region. In order to redirect the light into the small focal area where it supposed to be, adaptive optics [19] is vitally important. Using adaptive optics, the aberration can be compensated in two ways. One way is direct measurement of the aberrated wavefront using a wavefront sensor [e.g., Shack–Hartmann wavefront (SHW) sensor] and feedback to a deformable mirror (DM) to compensate the wavefront error. The wavefront can be measured by either introducing an artificial guide star [20–22] or using a sample that has been labeled with fluorescent proteins [23–25]. Recently, Tao et al. [26], reported the measurement of the wavefront from autofluorescent light from within the sample. In this direct wavefront measurement mode, the DM correction can be done using either a closed-loop or an open-loop control mode. In the former method, the wavefront is continuously measured and fed back to the DM until the corrected wavefront error is below a specified threshold. The closed-loop method has superior correction relative to open-loop correction, but it is time-consuming, since it requires several cycles of correction. The open-loop approach requires a calibrated DM system but is able to make the correction faster because it is done in a single step without iterations. Another method for wavefront correction is a sensorless method [27]. The advantage is that it does not require an additional wavefront sensor in the optical system. By applying different estimated Zernike modes to the DM and using the peak intensity [28] (or average intensity [29], image sharpness [30], or Fourier contents [31]) on a CCD camera as a figure of merit for optimization, it is possible to iteratively optimize the aberration and make the correction. Indeed, it requires less optical instrumentation; however, it is time-consuming. It is not suitable for a live imaging environment with rapidly changing wavefront errors.
The benefits of adaptive optics applied to several types of light microscopy have been reported. Examples include adaptive optical (AO) confocal microscopy [19,32], AO two-photon microscopy [26,29], and AO SIM [28,33,34]. AO correction provides better resolution, SNR, and contrast, and enables a deeper penetration depth. Recently, Thomas et al. [28] reported on the application of AO to SIM. In their wavefront sensorless system, a DM, the Mirao 52-e from Imagine Optics, was employed to compensate the wavefront aberration. Imaging a fluorescent nanoparticle under a 35 μm thick C. elegans worm, a 140 nm FWHM of the PSF was reported in their results after AO correction.
Although a high Strehl ratio of 0.8 was obtained after AO correction of the aberration caused by the C. elegans (rod shape), a drawback of this system is that it is not able to correct high-spatial-frequency aberrations, since the DM that was used (Mirao 52-e) has only 52 actuators (only 36 of the actuators are in the 15 mm effective aperture). This DM can correct high-amplitude wavefront error but not high-order (th Zernike) wavefront error. The sensorless mode for wavefront correction also may not be suitable for a sample with dynamic aberrations.
Sign up for Photonics Research TOC. Get the latest issue of Photonics Research delivered right to you!Sign up now
To overcome the previously discussed light microscopy limitations, Chen et al. [35] introduced a dual-DM adaptive optical system into a confocal microscope to enable high-order, high-amplitude wavefront correction and showed improvements in the dynamic range and quality of the wavefront correction for images of the human retina. In our work, we have introduced a dual-DM (woofer–tweeter) adaptive optical system into a widefield SI microscope (AOSIM). The benefit from the dual- DM configuration is the ability to compensate both large-amplitude and high-spatial-frequency wavefront aberrations to enable SIM in thick specimens. After correcting the wavefront aberration, the near-diffraction-limited PSF is further decreased by using the SI method. This paper is organized as follows. First, the woofer–tweeter AOSIM system design is presented. Then the AOSIM is characterized using 0.11 μm fluorescent beads as a target. The AOSIM is then tested by imaging the green fluorescent protein (GFP)-tagged dendrite of an anterior corner cell (aCC) in the Drosophila embryo. In the last section, there are discussions and conclusions for the work.
2. SYSTEM DESIGN
A. Woofer–Tweeter Dual-DM Adaptive Optical System
As schematically illustrated in Fig. 1, the dual-DM woofer and tweeter are placed sequentially in planes conjugated to the back pupil of the objective lens. The “tweeter,” a microelectromechanical systems DM from Boston Micromachines, has 140 actuators with a maximum stroke of 3.5 μm. It is set to correct low-amplitude but high-spatial-frequency wavefront errors. The “woofer,” a membrane DM (Mirao 52-e) from Imagine Optics, has 52 actuators with a maximum stroke of 50 μm. It is designed to correct the low-spatial-frequency but high-amplitude wavefront errors. In order to be suitable for live imaging, we utilized a fast direct wavefront measurement system known as the SHW sensor [36] that includes a lenslet array (97 of them are in the active aperture) and an electron-multiplying CCD (EMCCD) camera (Andor iXon, pixels). The number of lenslets is approximately the same as the maximum number of Zernike modes that can be corrected (Section 3.2 of Ref. [37]). Each lenslet has a focal length of 24 mm and is placed on a pitch of 0.328 mm to form the array. As shown in Fig. 1, the SHW sensor is placed at the conjugate plane of the back aperture of the objective lens. For the wavefront measurement, we made an artificial guide star by turning on 10 of the center pixels of the digital light projector (DLP). The microscope objective is an Olympus LUMFLN 60 (, water immersion lens, working ). The series of 2 in. (5.08 cm) lenses, through , are placed to readjust the beam size from 6.6 mm after the objective to match the different aperture sizes for the tweeter (4.4 mm) and the woofer (15 mm). The precalibrated woofer and tweeter are both under open-loop control.
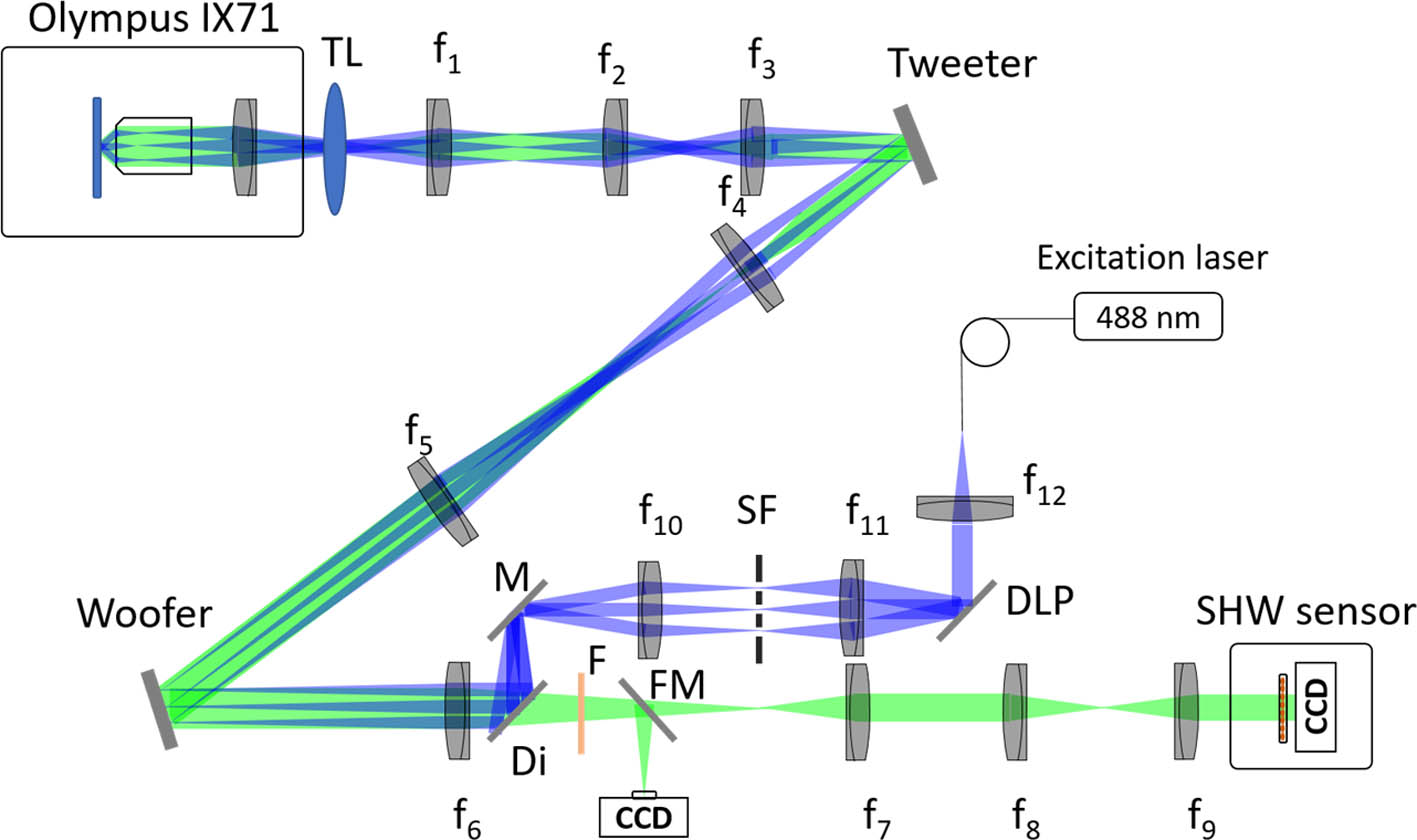
Figure 1.Layout of the woofer–tweeter AOSIM. The DLP with pixels (DLP3000 Texas Instruments) is placed at a conjugate plane of the objective lens focal plane. The SHW sensor consists of a lenslet array () and a CCD camera (Photometrics) and is placed at a conjugate plane of the objective lens aperture plane. Blue line, 488 nm excitation light path (488 nm excitation laser from Spectra-Physics); green line, 515 nm emission path. The focal lengths of the lenses are , , , , , , , , , , , . M, mirror; SF, spatial filter; TL, trial lens (cylinder); F, filter; Di, dichroic mirror; FM, flip mirror.
B. SIM
In the SI method, to gain a higher-resolution image in comparison to widefield microscopy, additional images are taken at different angles and phases with patterned excitation [7,38]. In the case of 2D SIM, typically nine images are required. Details of our SIM approach can be found in our previous work [39]. In generating fine structured light patterns in the focal plane, the conventional interference method often suffers from mechanical drifting of the diffraction grating and a low frame rate due to the requirement for mechanical motion of the grating. Instead of generating the SI pattern using a mechanical grating, here a DLP with micromirrors (DLP3000 from Texas Instruments) is used to directly generate the SI pattern [28,40,41]. The bandwidth of the DLP is 4 kHz. The laser beam is spatially and temporally decorrelated by a spinning ground glass disk (before the DLP) to prevent unwanted speckle patterns. A flip mirror was introduced before the Andor iXon EMCCD camera to direct the light to either the CCD camera or the SHW sensor. To get the maximum SI spatial resolution at the focal plane, we set the DLP to 3 pixels per line. In the SI method, the phase and frequency of the SI pattern is very sensitive to aberrations. RI mismatch or sample aberration will cause unclear fringes in the focal plane.
3. SYSTEM CHARACTERIZATION AND TESTING
The AOSIM system is characterized and tested by imaging 0.11 μm fluorescent beads [FluoSpheres carboxylate-modified microspheres, 0.11 μm, yellow-green fluorescent (505/515)]. The diluted fluorescent beads are sandwiched between a slide and coverslip (#1.5). To maximize the aberration effect at the focal plane of and , the common path of excitation and emission light, a trial lens (cylinder) is introduced. The introduced aberration is conjugated to the back pupil of the microscope objective. To measure the wavefront, we turn a few DLP mirror segments (10) to the “on” state to selectively excite a bead in this small area. The wavefront of this “guide star” is measured by the SHW sensor after flipping the mirror (FM). From the measured wavefront, we analyzed the wavefront error up to the 22nd Zernike mode, the root mean square (RMS) wavefront error, the peak-to-valley (P-V) wavefront error, and the Strehl ratio [37,42] (a ratio of the measured PSF intensity to its ideal theoretical predicted PSF intensity).
As shown in Fig. 2(a), due to the strong aberration introduced by the trial lens, without AO compensation, the fluorescent beads are not resolved. The corresponding reconstruction images using SIM, as shown in Fig. 2(e), also do not show any improvement. This is due to the fact that the aberration distorts the SI pattern of the focal plane. The reconstruction algorithm cannot detect any stripe modulation signal in Fourier space. As shown in Table 1, without AO correction (both DMs are in the flat shape), the distorted wavefront of Fig. 2(a) has a wavefront error of 8.93 waves (5.9 μm) and an RMS wavefront error that is up to 2.05 waves. In this case, the Strehl ratio is only 0.06. The values of the Zernike modes of the wavefront are shown in Fig. 3 (blue bar). Zernike mode 6, which represents the vertical astigmatism, is dominant in this wavefront aberration. This is well matched to the wavefront error of the introduced trial lens (cylinder). Note that the first four Zernike modes reflect piston, tip–tilt, and focus, which are not wavefront errors. Throughout our investigations, we did not correct these modes using AO. Figures 2(b) and 2(f) show images of 0.11 μm beads after using the woofer to compensate the low-order wavefront aberration (5th–8th Zernike modes). The SNR is significantly improved, and the beads are visible in the images. As also shown in Table 1, in this case, by compensating the low-order high-amplitude aberration, the P-V of the wavefront error decreases from 8.93 to 0.75 waves. However, the resolution of the 0.11 μm beads has not reached the diffraction limit, and the image quality is not improved using SI. This is because we are only correcting the low-order aberrations. The residual aberrations, which have RMS wavefront errors around 0.18, limit the Strehl ratio to 0.27, which is much lower than the diffraction limit (Strehl [42]). If only the tweeter is used to correct the whole aberration, due to its low stroke (maximum of 3.5 μm), the large-amplitude aberration cannot be compensated, as shown in Table 1. The residual aberrations still have a P-V wavefront error around 2.3 waves. The lower correction capability when using only the tweeter system leads to an RMS wavefront error of 0.46 and a Strehl ratio that is only 0.06. This limited correction capability can also be seen clearly in the images shown in Figs. 2(c) and 2(g). With wavefront correction from both the woofer and tweeter, as shown in Fig. 2(d), the wavefront error caused from the trial lens is well corrected and the 0.11 μm fluorescent beads are diffraction limited. Here, the first four Zernike modes are corrected by the woofer and the rest of the Zernike modes are corrected by the tweeter. After correction by the woofer–tweeter system, the P-V wavefront error is down to only 0.36 waves and has a very low RMS wavefront error (0.08 waves). As shown in Fig. 3, a comparison of AO compensation with and without woofer–tweeter correction, most of the Zernike modes are dramatically decreased after AO compensation. Furthermore, as shown in Fig. 4, the line profile plot of areas 1 and 2 in Figs. 2(d) and 2(h), with SI, compared to widefield only (black line), the two beads that are separated by around 145 nm are just resolved, demonstrating the ability to resolve two beads that are separated by a distance that is less than the Dawes diffraction limit.
| | No AO | Woofer (W) | Tweeter (T) | Both W and T |
| P-V (waves) | 8.93 | 0.75 | 2.31 | 0.36 |
| RMS (waves) | 2.05 | 0.18 | 0.46 | 0.08 |
| Strehl ratio | 0.06 | 0.27 | 0.08 | 0.75 |
Table 1. Analysis of Measured Wavefront of Figs. 2(a)–2(d)a

Figure 2.Comparison of (a)–(d) widefield and (e)–(h) SIM microscope images with and without wavefront correction. The figure shows the images of nanoparticles (110 nm) after introducing trial lens in between lenses and . (a), (e) Without AO correction; (b), (f) woofer-only correction; (c), (d) tweeter-only correction; (d), (h) both woofer and tweeter correction. The scale bar is 5 μm.
Figure 3.Zernike modes of the wavefront errors with and without woofer–tweeter correction. The inset is the value of the remaining Zernike modes after removing the sixth-order vertical astigmatism. The Zernike order is in Noll single-index order [43].
Figure 4.Comparison of 0.11 μm beads under AO widefield (black line) and AOSIM (red line), Shown as line plots of the intensity of beads in areas 1 and 2 of Figs. 2(d) and 2(h). (a) Intensity profile of two closely spaced beads. The distance between two well-resolved peaks in AOSIM is 145 nm. (b) The FWHMs of a single bead in widefield and AOSIM are 235 and 140 nm, respectively.
The measured size of a bead under widefield and AOSIM is 235 and 140 nm, respectively. With AOSIM, the FWHM of a bead is decreased by a factor of . In this experiment, most of the aberration is compensated by the woofer–tweeter system. The Strehl ratio is increased from 0.06 up to 0.75.
We also tested AOSIM imaging through a Drosophila embryo. The results are shown in Fig. 5. Without AO correction [Fig. 5(a)], the cell bodies and dendrites of the aCC and RP2 motoneurons are blurry. The Zernike mode of the wavefront error is shown in Fig. 6. The aberration is mainly caused by the RI mismatch between the cover slip (#1.5 coverslip RI: 1.5), the mounting medium (Fluoreomount G RI: 1.4), and the sample. With dual DM compensation, the images [Fig. 5(b)] show that the fluorescent signal is increased up to 5 times in comparison to the image without AO correction [Fig. 5(e), green line versus black line]. After correction, the Strehl ratio is up to 0.85, which is much larger than before correction (0.50). Furthermore, using the SIM method, the red line in Fig. 5(e) shows that the detailed structure of the dendrites that sprouted from the axon [43] is well resolved.
Figure 5.Images of GFP-labeled aCC/RP2 motoneurons of a Drosophila embryo. (a) Widefield without AO, (b) SIM without AO, (c) widefield with AO, (d) SIM with AO, (e) intensity plots of the line profiles in (a)–(d). The lines are along the dendrites of the aCC. The scale bar is 10 μm.
Figure 6.Zernike modes of the Drosophila embryo wavefront errors with and without woofer–tweeter correction [43].
4. DISCUSSION AND CONCLUSIONS
We have demonstrated that the combination of woofer–tweeter adaptive optics and SIM can correct high-amplitude low-spatial-frequency and low-amplitude high-spatial-frequency wavefront aberration and provides high-contrast high-resolution images. The experimental results showed that the system can correct large aberrations (P-V: 8.93 waves). As compared to the widefield microscope, the SI method allowed two beads that are separated by 145 nm to be resolved, below the diffraction limit of 235 nm. The resolution improvement is a bit lower than the ideal case of 2. In a highly aberrated or strongly scattering sample, the contrast of the SI pattern in the image plane degrades as the spatial frequency of the light approaches the cutoff frequency of the objective lens. In our experiment, the spatial frequency of the stripes is a bit lower than the cutoff frequency of the objective lens to ensure having high-contrast stripes in the focal plane.
Acknowledgment
Acknowledgment. The results presented herein were obtained at the W.M. Keck Center for Adaptive Optical Microscopy (CfAOM) at the University of California, Santa Cruz. The CfAOM was made possible by the generous financial support of the W.M. Keck Foundation. This material is based upon work supported by the UC Office of the President for the UC Work Group for Adaptive Optics in Biological Imaging, by the Multicampus Research Programs and Initiatives. This material is also based upon work supported by the National Science Foundation. Any opinions, findings, and conclusions or recommendations expressed in this material are those of the authors and do not necessarily reflect the views of the NSF. D. K. and B. H. are supported by the NIH.
References
[1] F. Helmchen, W. Denk. Deep tissue two-photon microscopy. Nat. Methods, 2, 932-940(2005).
[2] M. Rajadhyaksha, M. Grossman, D. Esterowitz, R. H. Webb, R. R. Anderson. In vivo confocal scanning laser microscopy of human skin: melanin provides strong contrast. J. Invest. Dermatol., 104, 946-952(1995).
[3] P. Kner, J. W. Sedat, D. A. Agard, Z. Kam. High-resolution widefield microscopy with adaptive optics for spherical aberration correction and motionless focusing. J. Microsc., 237, 136-147(2010).
[4] E. Betzig, G. H. Patterson, R. Sougrat, O. W. Lind-Wasser, S. Olenych, J. S. Bonifacino, M. W. Davidson, J. Lippincott-Schwartz, H. F. Hess. Imaging intra-cellular fluorescent proteins at nanometer resolution. Science, 313, 1642-1645(2006).
[5] M. G. L. Gustafsson. Nonlinear structured-illumination microscopy: widefield fluorescence imaging with theoretically unlimited resolution. Proc. Natl. Acad. Sci. USA, 102, 13081-13086(2005).
[6] S. W. Hell, J. Wichmann. Breaking the diffraction resolution limit by stimulated emission: stimulated-emission-depletion fluorescence microscopy. Opt. Lett., 19, 780-782(1994).
[7] M. G. L. Gustafsson. Surpassing the lateral resolution limit by a factor of two using structured illumination microscopy. J. Microsc., 198, 82-87(2000).
[8] M. G. L. Gustafsson, D. A. Agard, J. W. Sedat. Doubling the lateral resolution of wide-field fluorescence microscopy using structured illumination. Proc. SPIE, 3919, 141-150(2000).
[9] P. Gao, G. Pedrini, W. Osten. Structured illumination for resolution enhancement and autofocusing in digital holographic microscopy. Opt. Lett., 38, 1328-1330(2013).
[10] W. Gong, K. Si, N. Chen, C. J. R. Sheppard. Improved spatial resolution in fluorescence focal modulation microscopy. Opt. Lett., 34, 3508-3510(2009).
[11] M. G. Gustafsson, L. Shao, P. M. Carlton, C. J. R. Wang, I. N. Golubovskaya, W. Z. Cande, D. A. Agard, J. W. Sedat. Three-dimensional resolution doubling in wide-field fluorescence microscopy by structured illumination. Biophys. J., 94, 4957-4970(2008).
[12] E. H. K. Stelzer. Light-sheet fluorescence microscopy for quantitative biology. Nat. Methods, 12, 23-26(2014).
[13] V. Trivedi, T. V. Truong, L. A. Trinh, D. B. Holland, M. Liebling, S. E. Fraser. Dynamic structure and protein expression of the live embryonic heart captured by 2-photon light sheet microscopy and retrospective registration. Biomed. Opt. Express, 6, 2056-2066(2015).
[14] M. A. A. Neil, R. Ju skaitis, T. Wilson. Method of obtaining optical sectioning by using structured light in a conventional microscope. Opt. Lett., 22, 1905-1907(1997).
[15] J. Mertz. Optical sectioning microscopy with planar or structured illumination. Nat. Methods, 8, 811-819(2011).
[16] P. Gao, U. Nienhaus. Confocal laser scanning microscopy with spatiotemporal structured illumination. Opt. Lett., 41, 1193-1196(2016).
[17] Q. Song, K. Isobe, K. Hirosawa, K. Midorikawa, F. Kannari. 2D simultaneous spatial and temporal focusing multiphoton microscopy for fast volume imaging with improved sectioning ability. Proc. SPIE, 9329, 93292N(2015).
[18] N. G. Horton, K. Wang, D. Kobat, C. G. Clark, F. W. Wise, C. B. Schaffer, C. Xu. In vivo three-photon microscopy of subcortical structures within an intact mouse brain. Nat. Photonics, 7, 205-209(2013).
[19] J. A. Kubby. Adaptive Optics for Biological Imaging(2013).
[20] O. Azucena, J. Crest, J. Cao, W. Sullivan, P. Kner, D. Gavel, D. Dillon, S. Olivier, J. Kubby. Wavefront aberration measurements and corrections through thick tissue using fluorescent microsphere reference beacons. Opt. Express, 18, 17521-17532(2010).
[21] O. Azucena, J. Crest, S. Kotadia, W. Sullivan, X. Tao, M. Reinig, D. Gavel, S. Olivier, J. Kubby. Adaptive optics widefield microscopy using direct wavefront sensing. Opt. Lett., 36, 825-827(2011).
[22] P. Vermeulen, E. Muro, T. Pons, V. Loriette, A. Fragola. Adaptive optics for fluorescence widefield microscopy using spectrally independent guide star and markers. J. Biomed. Opt., 16, 076019(2011).
[23] X. Tao, B. Fernandez, O. Azucena, M. Fu, D. Garcia, Y. Zuo, D. C. Chen, J. Kubby. Adaptive optics confocal microscopy using direct wavefront sensing. Opt. Lett., 36, 1062-1064(2011).
[24] X. Tao, J. Crest, S. Kotadia, O. Azucena, D. C. Chen, B. Sullivan, J. Kubby. Live imaging using adaptive optics with fluorescent protein guide-stars. Opt. Express, 20, 15969-15982(2012).
[25] R. Aviles-Espinosa, A. Jordi, R. Porcar-Guezenec, O. E. Olarte, M. Nieto, L. Xavier, D. Artigas, P. Loza-Alvarez. Measurement and correction of in vivo sample aberrations employing a nonlinear guide-star in two-photon excited fluorescence microscopy. Biomed. Opt. Express, 2, 3135-3149(2011).
[26] X. Tao, A. Norton, M. Kissel, O. Azucena, J. Kubby. Adaptive optical two-photon microscopy using auto fluorescent guide stars. Opt. Lett., 38, 5075-5078(2013).
[27] M. Booth. Wave front sensor-less adaptive optics: a model-based approach using sphere packings. Opt. Express, 14, 1339-1352(2006).
[28] B. Thomas, A. Wolstenholme, S. N. Chaudhari, E. T. Kipreos, P. Kner. Enhanced resolution through thick tissue with structured illumination and adaptive optics. J. Biomed. Opt., 20, 026006(2015).
[29] D. Debarre, E. J. Botcherby, T. Watanabe, S. Srinivas, M. J. Booth, T. Wilson. Image-based adaptive optics for two-photon microscopy. Opt. Lett., 34, 2495-2497(2009).
[30] D. Debarre, E. J. Botcherby, M. J. Booth, T. Wilson. Adaptive optics for structured illumination microscopy. Opt. Express, 16, 9290-9305(2008).
[31] K. F. Tehrani, J. Xu, Y. Zhang, P. Shen, P. Kner. Adaptive optics stochastic optical reconstruction microscopy (AO-STORM) using a genetic algorithm. Opt. Express, 23, 13677-13692(2015).
[32] M. J. Booth, M. A. A. Neil, R. Juskaitis, T. Wilson. Adaptive aberration correction in a confocal microscope. Proc. Natl. Acad. Sci. USA, 99, 5788-5792(2002).
[33] P. Krizek, I. Raaka, G. M. Hagen. Flexible structured illumination microscope with a programmable illumination array. Opt. Express, 20, 24585-24599(2012).
[34] M. Pedrazzani, V. Loriette, P. Tchenio, S. Benrezzak, D. Nutarelli, A. Fragola. Sensorless adaptive optics implementation in widefield optical sectioning microscopy inside in vivo Drosophila brain. J. Biomed. Opt., 21, 036006(2016).
[35] D. C. Chen, S. M. Jones, D. A. Silva, S. S. Olivier. High-resolution adaptive optics scanning laser ophthalmoscope with dual deformable mirrors. J. Opt. Soc. Am. A, 24, 1305-1312(2007).
[36] B. C. Platt, R. Shack. History and principles of Shack–Hartmann wavefront sensing. J. Refractive Surg., 17, S573-S577(2001).
[37] J. Porter. Adaptive Optics for Vision Science: Principles, Practices, Design, and Applications(2006).
[38] S. A. Shroff, J. R. Fienup, D. R. Williams. OTF compensation in structured illumination superresolution images. Proc. SPIE, 7094, 709402(2008).
[39] M. Kissel, M. Reinig, O. Azucena, J. J. Diaz Leon, J. Kubby. Development and testing of an AO-structured illumination microscope. Proc. SPIE, 8978, 89780G(2014).
[40] A. Masson, M. Pedrazzani, S. Benrezzak, P. Tchenio, T. Preat, D. Nutarelli. Micromirror structured illumination microscope for high-speed in vivo drosophila brain imaging. Opt. Express, 22, 1243-1256(2014).
[41] N. Chakrova, R. Heintzmann, B. Rieger, S. Stallinga. Studying different illumination patterns for resolution improvement in fluorescence microscopy. Opt. Express, 23, 31367-31383(2015).
[42] J. W. Hardy. Adaptive Optics for Astronomical Telescopes(1998).
[43] M. R. Reinig, S. W. Novak, X. Tao, L. A. Bentolila, D. G. Roberts, A. MacKenzie-Graham, S. E. Godshalk, M. A. Raven, D. W. Knowles, J. Kubby. Enhancing image quality in cleared tissue with adaptive optics. J. Biomed. Opt., 21, 121508(2016).


