• Infrared and Laser Engineering
  • Vol. 50, Issue 9, 20200441 (2021)
Weizhe Ma1, Meirong Dong1、3、4, Yongru Huang1, Qi Tong1, Liping Wei1、2、3、4, and Jidong Lu1、3、4
Author Affiliations
  • 1School of Electric Power, South China University of Technology, Guangzhou 510640, China
  • 2Vkan Certification & Technology Co., Ltd., Guangzhou 510663, China
  • 3Guangdong Province Engineering Research Center of High Efficient and Low Pollution Energy Conversion, Guangzhou 510640, China
  • 4Guangdong Province Key Laboratory of Efficient and Clean Energy Utilization, Guangzhou 510640, China
  • show less
    DOI: 10.3788/IRLA20200441 Cite this Article
    Weizhe Ma, Meirong Dong, Yongru Huang, Qi Tong, Liping Wei, Jidong Lu. Quantitative analysis method of unburned carbon content of fly ash by laser-induced breakdown spectroscopy[J]. Infrared and Laser Engineering, 2021, 50(9): 20200441 Copy Citation Text show less
    Schematic diagram of LIBS system
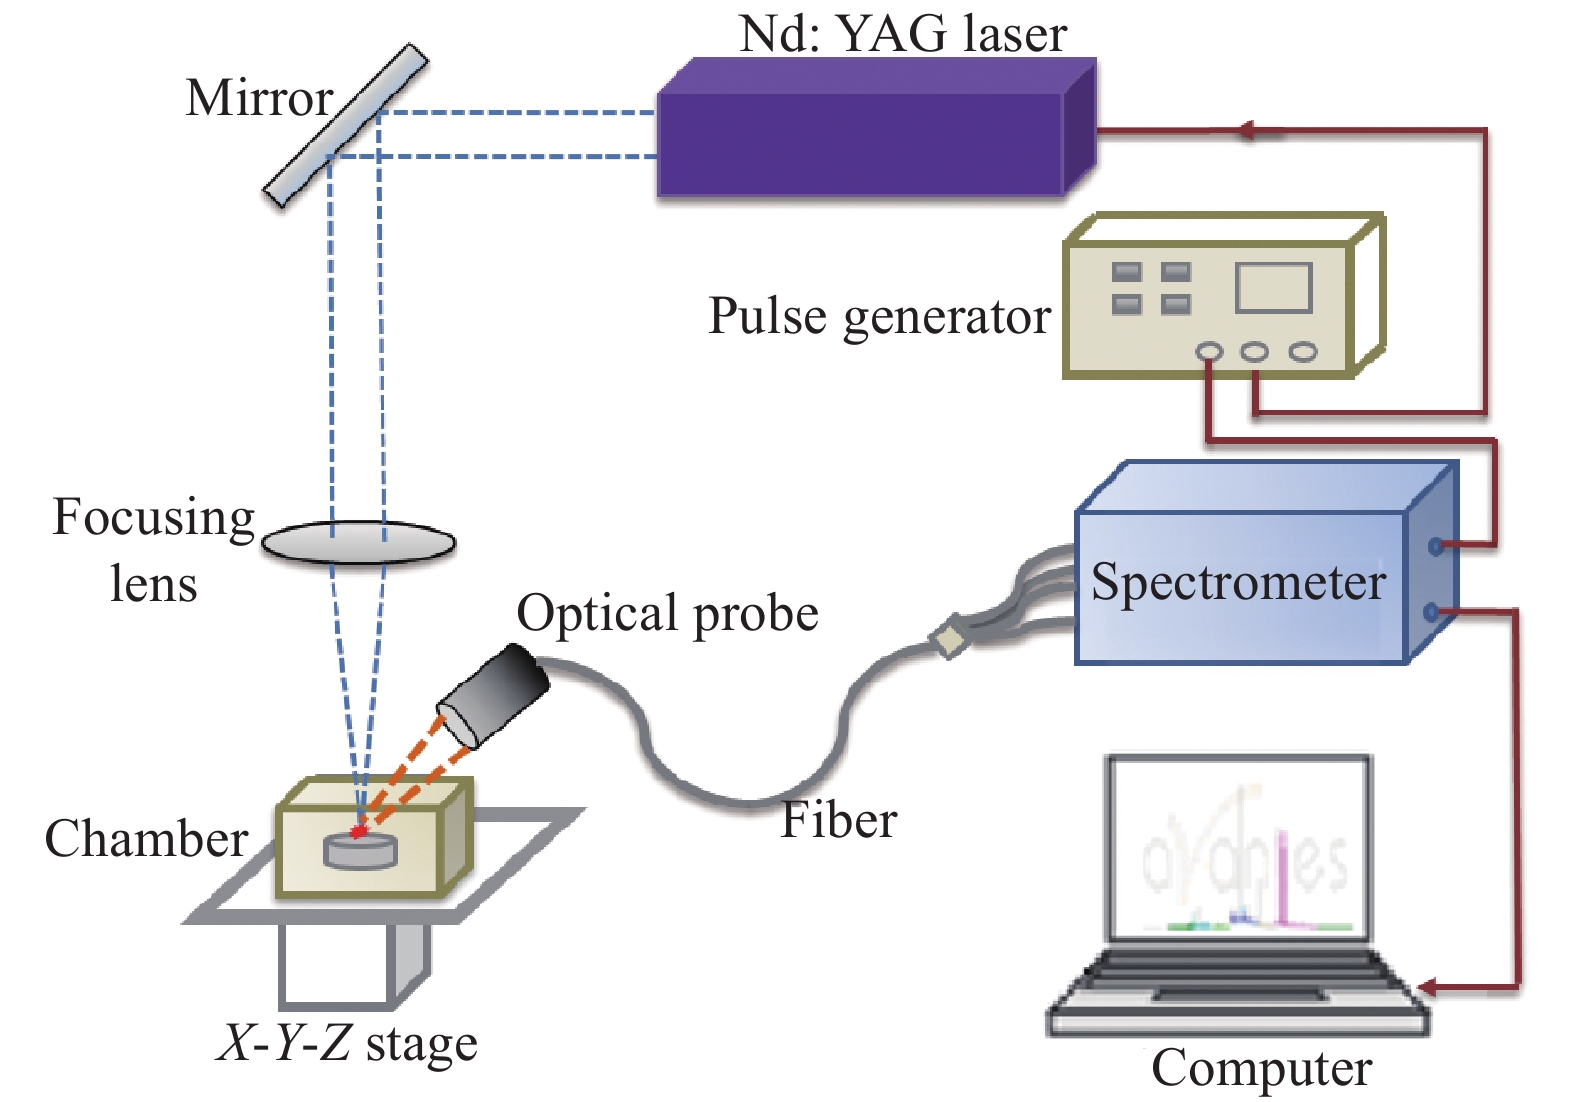
    Fig. 1. Schematic diagram of LIBS system
    LIBS spectrum of fly ash sample(#1)
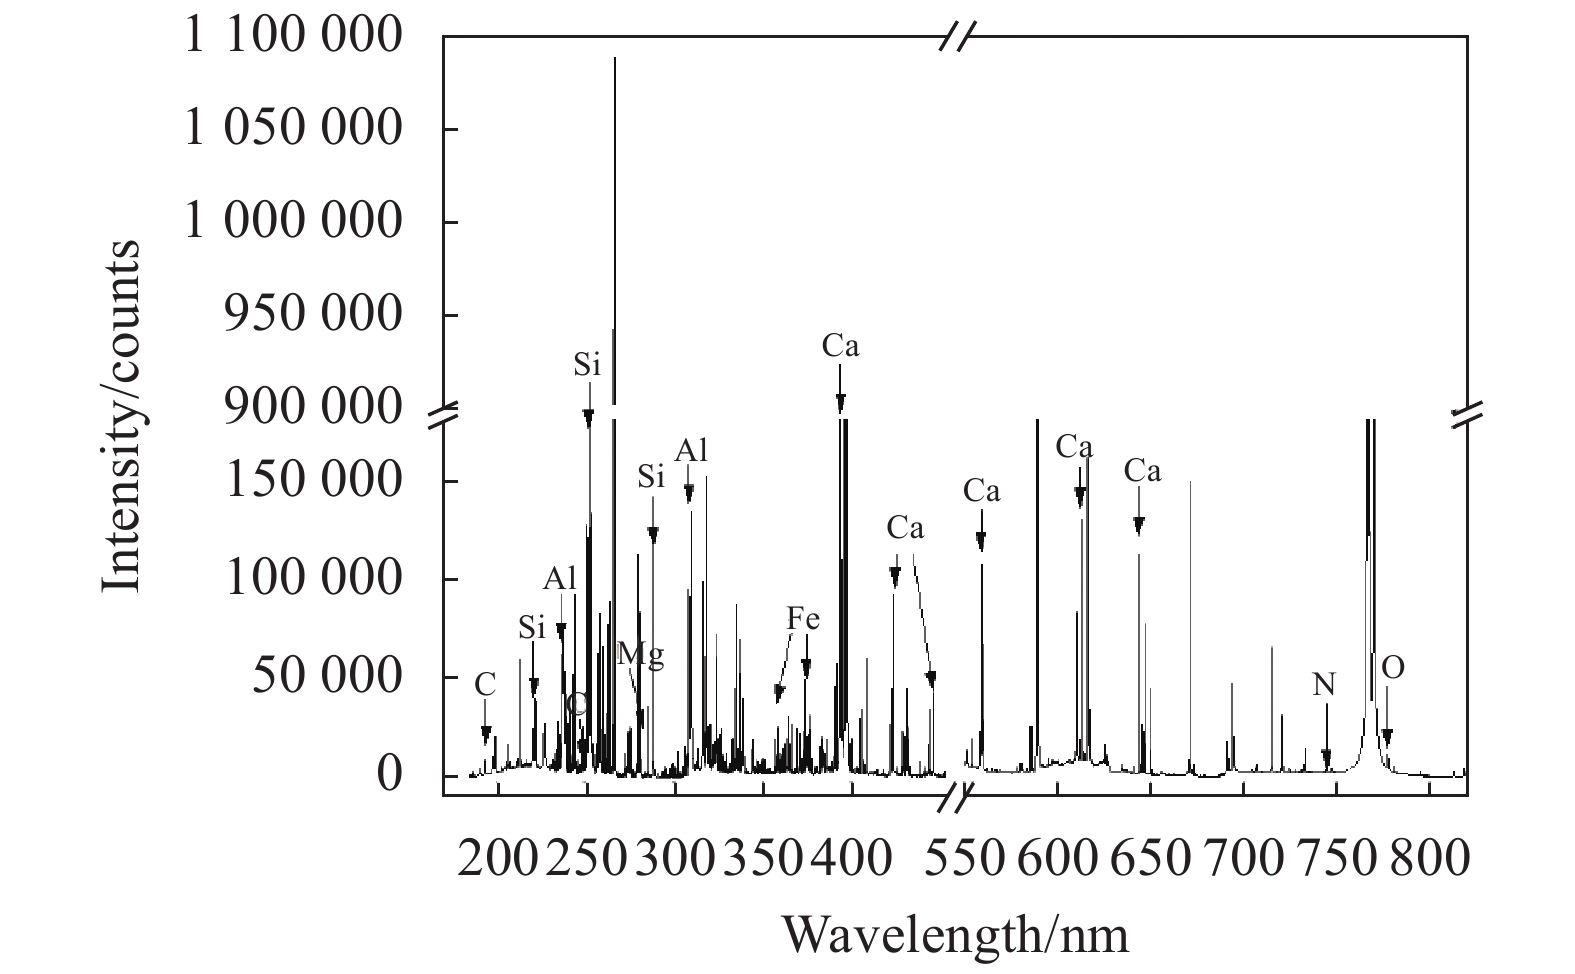
    Fig. 2. LIBS spectrum of fly ash sample(#1)
    Cross validation results of carbon content in fly ash based on MLR model 1 (a), 2 (b), 3 (c)
    Fig. 3. Cross validation results of carbon content in fly ash based on MLR model 1 (a), 2 (b), 3 (c)
    Cross validation results of carbon content in fly ash based on PLSR model 1 (a), 2 (b), 3 (c)
    Fig. 4. Cross validation results of carbon content in fly ash based on PLSR model 1 (a), 2 (b), 3 (c)
    Cross validation results of carbon content in fly ash based on ELM model 1 (a), 2 (b), 3 (c)
    Fig. 5. Cross validation results of carbon content in fly ash based on ELM model 1 (a), 2 (b), 3 (c)
    Cross validation results of carbon content in fly ash based on SVR model 1 (a), 2 (b), 3 (c)
    Fig. 6. Cross validation results of carbon content in fly ash based on SVR model 1 (a), 2 (b), 3 (c)
    Sample No. Carbon content (wt.%) Sample No. Carbon content(wt.%) Sample No. Carbon content (wt.%) Sample No. Carbon content (wt.%)
    #11.48#63.27#115.58#168.20
    #21.73#73.68#125.96#178.64
    #31.99#83.97#136.21#189.03
    #42.72#94.46#147.20#199.51
    #52.98#104.89#157.62#2010.43
    Table 1. Unburned carbon content of twenty fly ash samples
    ElementCharacteristic spectral line/nm
    C193.66, 247.877
    N744.333, 746.932
    O777.21
    Si205.898, 221.167, 221.698, 251.669, 251.983, 252.423, 252.863, 288.165
    Fe248.827, 249.081, 371.952, 373.452, 373.702, 374.534, 374.949, 375.862
    Ca393.356, 396.808, 422.649, 442.577, 443.52, 445.472, 558.857, 610.351, 612.3, 616.278, 643.99, 646.305, 649.433
    Al236.787, 237.24, 257.551, 308.223, 309.311, 394.402, 396.167
    Mg277.976, 285.207, 516.709, 517.316, 519.392
    Table 2. Characteristic spectral lines of fly ash samples
    MLRPLSR
    Cross validation results1Sample No.Reference valueR2=0.96 R2=0.99
    Predicted valueRDRSDPredicted valueRDRSD
    63.27%3.15%3.57%18.93%2.49%23.79%7.66%
    125.96%5.74%3.66%15.15%5.90%0.93%27.61%
    189.03%9.01%0.16%9.10%7.72%14.46%1.28%
    Average value--2.46%14.39%-13.06%12.18%
    Cross validation Results2Sample No.Reference valueR2=0.96 R2=0.99
    Predicted valueRDRSDPredicted valueRDRSD
    52.98%3.32%11.46%6.62%2.72%8.67%46.92%
    115.58%6.02%7.74%33.39%6.39%14.42%25.78%
    178.64%8.97%7.26%15.77%9.05%4.70%11.20%
    Average value--8.97%18.59%-9.26%27.97%
    Cross validation results3Sample No.Reference valueR2=0.96 R2=0.99
    Predicted valueRDRSDPredicted valueRDRSD
    125.96%5.81%2.42%15.15%5.51%7.46%28.95%
    147.20%7.71%7.06%10.74%7.81%8.41%14.16%
    178.64%9.34%8.05%10.19%8.95%3.58%3.68%
    Average value--5.84%12.03%-6.48%15.60%
    Table 3. Prediction results of fly ash carbon content based on MLR and PLSR models
    ELMSVR
    Cross validation results 1Sample No.Reference valueR2=0.99 R2=0.99
    Predicted valueRDRSDPredicted valueRDRSD
    63.27%3.45%5.51%3.13%3.24%1.02%6.32%
    125.96%6.37%7.00%17.53%5.97%0.25%7.18%
    189.03%8.18%9.35%6.97%8.72%3.36%9.10%
    Average value--7.29%9.21%-1.54%7.53%
    Cross validation results 2Sample No.Reference valueR2=0.99 R2=0.99
    Predicted valueRDRSDPredicted valueRDRSD
    52.98%2.92%1.99%2.63%3.09%3.83%1.17%
    115.58%6.84%22.59%12.51%5.94%6.41%1.99%
    178.64%8.66%0.19%9.31%8.63%0.10%5.51%
    Average value--8.26%8.15%-3.45%2.89%
    Cross validation results 3Sample No.Reference valueR2=0.99 R2=0.99
    Predicted valueRDRSDPredicted valueRDRSD
    125.96%5.46%8.27%4.10%5.86%1.64%6.90%
    147.20%8.49%17.89%13.41%7.72%7.22%4.45%
    178.64%8.55%1.03%3.01%8.79%1.67%10.20%
    Average value--9.06%6.84%-3.51%7.18%
    Table 4. Prediction results of carbon content in fly ash based on ELM and SVR models
    Weizhe Ma, Meirong Dong, Yongru Huang, Qi Tong, Liping Wei, Jidong Lu. Quantitative analysis method of unburned carbon content of fly ash by laser-induced breakdown spectroscopy[J]. Infrared and Laser Engineering, 2021, 50(9): 20200441
    Download Citation