
Yu-yang LI, Yan-ni GUO, Jun-yu ZHU, Lei ZHOU, Yong-qiang ZHOU, Chun-hua HU. Characterizing Chromophoric Dissolved Organic Matter (CDOM) in Lake Chaohu in Different Hydrologic Seasons[J]. Spectroscopy and Spectral Analysis, 2021, 41(10): 3286
- Spectroscopy and Spectral Analysis
- Vol. 41, Issue 10, 3286 (2021)
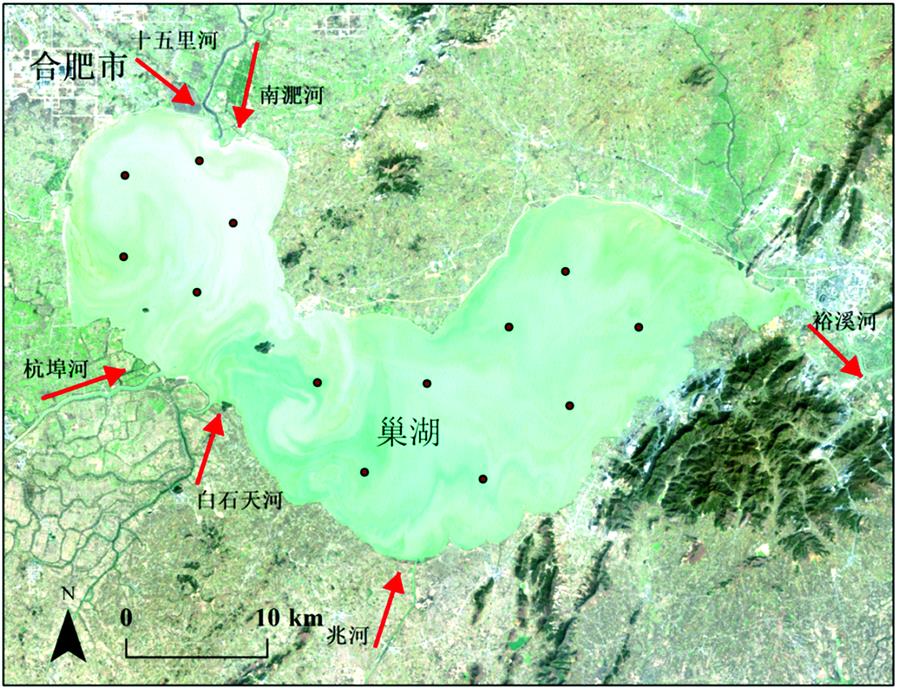
Fig. 1. Location of sampling sites in Lake Chaohu in January, April, and July 2018
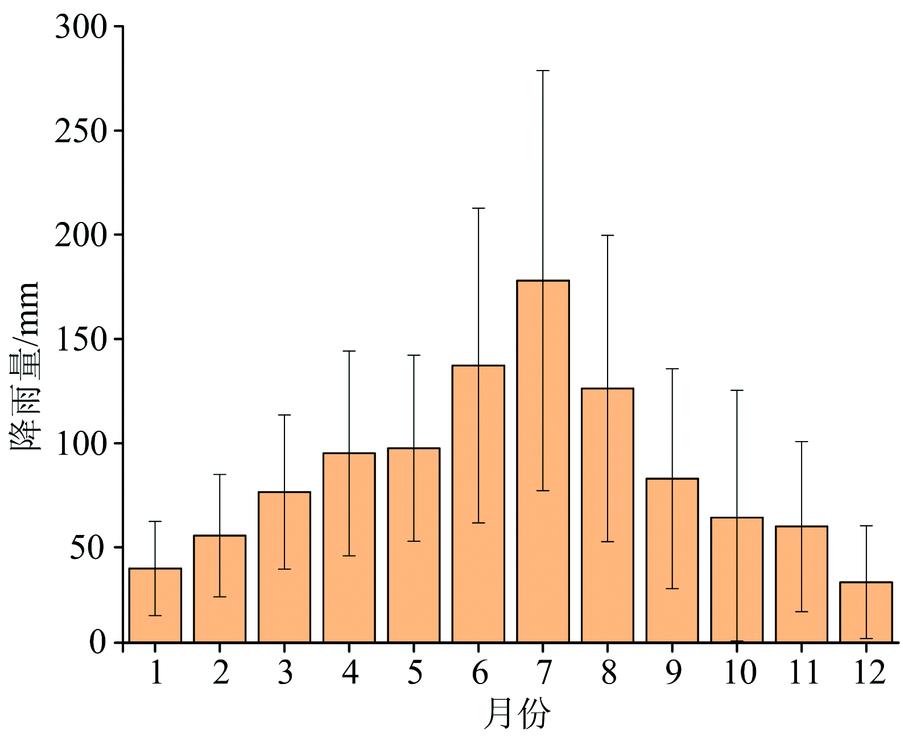
Fig. 2. Mothly average rainfall in the Chaohu Lake Basin from (1961—2018)
Fig. 3. Spatial distribution of dead, flat water and water-rich a 350, DOC, S 275~295
Fig. 4. The three fluorescent components obtained using parallel factor analysis and the split-half validation results were also shown
Fig. 5. Spatial distribution of the four fluorescent components in the dry, the wet-to-dry transition, and the wet seasons
Fig. 6. Correlation between DOC, TN, TP and shortwave humus components C1, tryptophan component scoline C2, tyrosine component C3, and longwave humus components C4
Fig. 7. Spatial distribution of Chl-a , TP, TN in Lake Chaohuin the dry, the wet-to-dry transition, and the wet seasons
| ||||||||||||||||||||||||||||||||||||
Table 1. Comparison of mean and t -test results of the CDOM optical indices of Lake Chaohu during the dry and the wet seasons
|
Table 2. Pearson correlation coefficient between microbial humic-like C1, tryptophan-like C2, tyrosine-like C3, and terrestrial humic-like C4 and water quality parameters

Set citation alerts for the article
Please enter your email address
© Copyright 2018-2021 | Chinese Laser Press. All Rights Reserved 沪ICP备15018463号-20