
Gangjie Zhou, Yanqing Fu, Shiliang Kang, Changgui Lin. Crystallization Behavior and Up-Conversion Luminescence of Er3+-Doped Chalcogenide Glasses[J]. Laser & Optoelectronics Progress, 2022, 59(15): 1516008
- Laser & Optoelectronics Progress
- Vol. 59, Issue 15, 1516008 (2022)
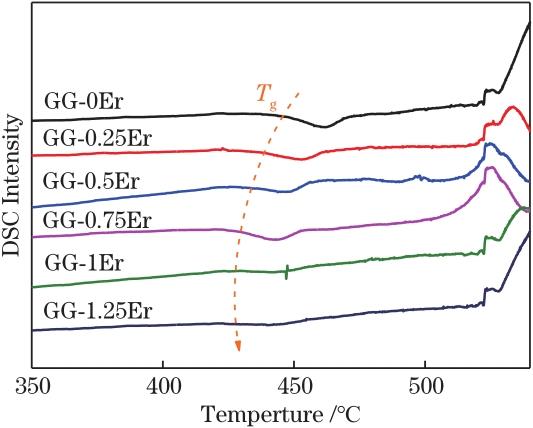
Fig. 1. DSC spectra of 80GeS2·20Ga2S3+xEr (GG-xEr, x=0, 0.25, 0.5, 0.75, 1, 1.25) chalcogenide glass samples
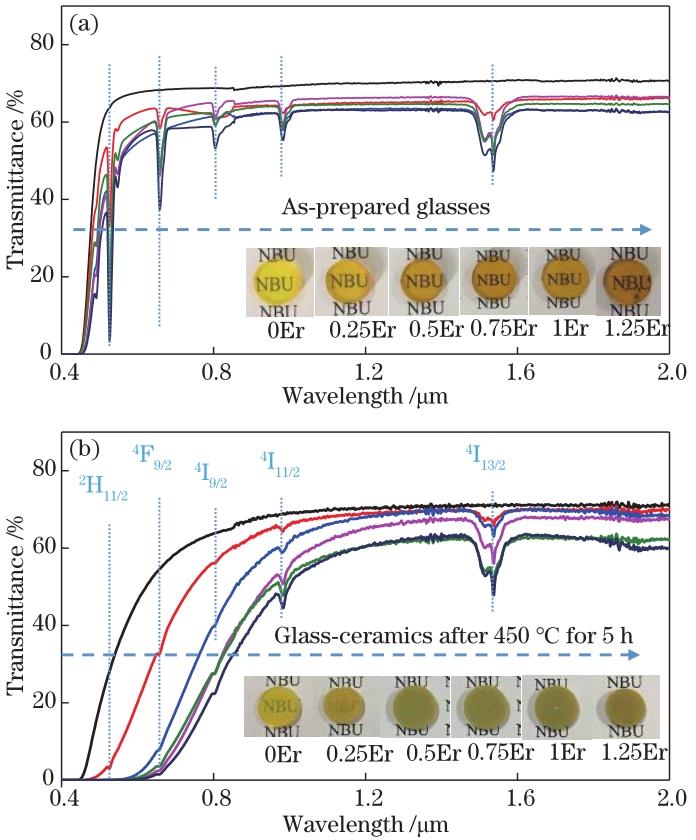
Fig. 2. Transmission spectrum. (a) 80GeS2·20Ga2S3+xEr (GG-xEr, x=0, 0.25, 0.5, 0.75, 1, 1.25) chalcogenide glass; (b) glass-ceramic after crystallization at 450 °C for 5 h (inset: sample photo)
Fig. 3. XRD pattern. (a) 80GeS2·20Ga2S3+xEr (GG-xEr, x=0, 0.25, 0.5, 0.75, 1, 1.25) chalcogenide glass; (b) glass-ceramic sample after crystallization treatment at 450 ℃ for 5 h
Fig. 4. FESEM images. (a) GG-0Er chalcogenide glass; (b) glass-ceramic samples after crystallization treatment at 450 ℃ for 5 h
Fig. 5. Up-conversion spectra under excitation at 1550 nm. (a) GG-xEr chalcogenide glass; (b) glass-ceramic sample after crystallization treatment at 450 °C for 5 h; (c) luminescence intensity at 980 nm as a function of Er ion doping mole fraction

Set citation alerts for the article
Please enter your email address
© Copyright 2018-2021 | Chinese Laser Press. All Rights Reserved 沪ICP备15018463号-20