• Photonics Research
  • Vol. 9, Issue 2, 259 (2021)
Kun Huang1、*, Yinqi Wang1, Jianan Fang1, Weiyan Kang2, Ying Sun2, Yan Liang2, Qiang Hao2, Ming Yan1, and Heping Zeng1、3、4、5、6
Author Affiliations
  • 1State Key Laboratory of Precision Spectroscopy, East China Normal University, Shanghai 200062, China
  • 2School of Optical Electrical and Computer Engineering, University of Shanghai for Science and Technology, Shanghai 200093, China
  • 3Jinan Institute of Quantum Technology, Jinan 250101, China
  • 4CAS Center for Excellence in Ultra-intense Laser Science, Shanghai 201800, China
  • 5Shanghai Research Center for Quantum Sciences, Shanghai 201315, China
  • 6e-mail: hpzeng@phy.ecnu.edu.cn
  • show less
    DOI: 10.1364/PRJ.410302 Cite this Article Set citation alerts
    Kun Huang, Yinqi Wang, Jianan Fang, Weiyan Kang, Ying Sun, Yan Liang, Qiang Hao, Ming Yan, Heping Zeng. Mid-infrared photon counting and resolving via efficient frequency upconversion[J]. Photonics Research, 2021, 9(2): 259 Copy Citation Text show less
    (a) Energy transition diagram for coherent down- and upconverters based on a second-order nonlinear process. The downconverter is used to prepare an MIR source with a well-calibrated power, which is essential in characterizing the detection performances for the MIR upconverter. (b) Experimental setup for MIR upconversion detection system based on passively synchronized fiber lasers. Initial source preparation for subsequent nonlinear conversion was realized by two Er- and Yb-doped fiber lasers (EDFL and YDFL) and multistage fiber amplifiers. The resultant amplified pulses at 1.03 and 1.55 μm were used to generate the MIR signal. Another branch of amplified pulse at 1.03 μm served as the pump, which was used to spectrally convert the MIR signal to the visible band for efficient single-photon and PNR detection. LD, laser diode; WDM, wavelength division multiplexer; Col, collimator; ISO, isolator; Yb/Er, ytterbium- or erbium-doped gain fiber; DCF, double-clad fiber; PCF, photonic crystal fiber; Atten, neutral density attenuator; M, dichroic concave mirror; FM, flip mirror; PPLN, periodically poled lithium niobate crystal; SPF, LPF, and BPF: short-, long-, and bandpass filter; APD, avalanche photodiode; MPPC, multipixel photon counter.
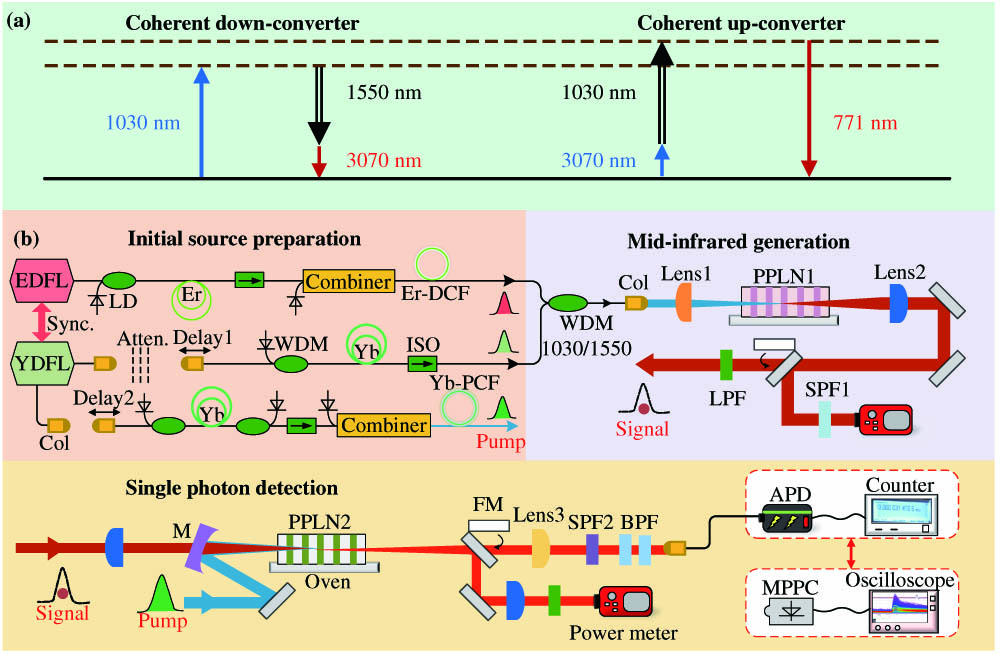
    Fig. 1. (a) Energy transition diagram for coherent down- and upconverters based on a second-order nonlinear process. The downconverter is used to prepare an MIR source with a well-calibrated power, which is essential in characterizing the detection performances for the MIR upconverter. (b) Experimental setup for MIR upconversion detection system based on passively synchronized fiber lasers. Initial source preparation for subsequent nonlinear conversion was realized by two Er- and Yb-doped fiber lasers (EDFL and YDFL) and multistage fiber amplifiers. The resultant amplified pulses at 1.03 and 1.55 μm were used to generate the MIR signal. Another branch of amplified pulse at 1.03 μm served as the pump, which was used to spectrally convert the MIR signal to the visible band for efficient single-photon and PNR detection. LD, laser diode; WDM, wavelength division multiplexer; Col, collimator; ISO, isolator; Yb/Er, ytterbium- or erbium-doped gain fiber; DCF, double-clad fiber; PCF, photonic crystal fiber; Atten, neutral density attenuator; M, dichroic concave mirror; FM, flip mirror; PPLN, periodically poled lithium niobate crystal; SPF, LPF, and BPF: short-, long-, and bandpass filter; APD, avalanche photodiode; MPPC, multipixel photon counter.
    Spectrotemporal characterization of involved light pulses. (a) and (c) are the measured optical spectra for the output pulses from the YDFL and EDFL, respectively. (b) and (d) give the corresponding autocorrelation traces. A scaling factor of 2 was taken to deduce the actual pulse duration with the assumption of a Gaussian profile. (e) Optical spectrum for the MIR signal source; (f) cross-correlation trace between signal and pump pulses.
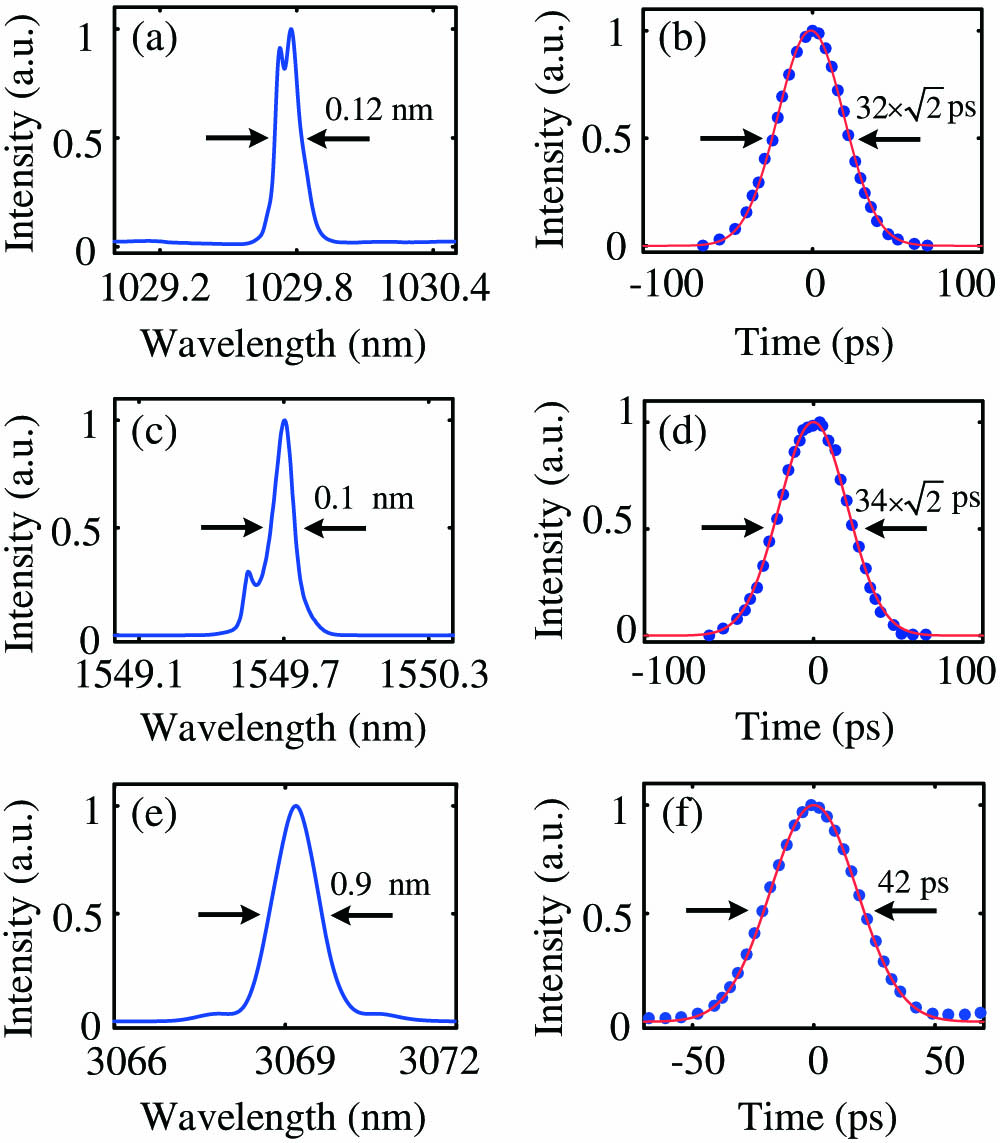
    Fig. 2. Spectrotemporal characterization of involved light pulses. (a) and (c) are the measured optical spectra for the output pulses from the YDFL and EDFL, respectively. (b) and (d) give the corresponding autocorrelation traces. A scaling factor of 2 was taken to deduce the actual pulse duration with the assumption of a Gaussian profile. (e) Optical spectrum for the MIR signal source; (f) cross-correlation trace between signal and pump pulses.
    Conversion efficiency and undepletion rate as functions of the pump power. The MIR signal was set at the megawatt level, thus ensuring the fulfillment of the nondepleted pump approximation. The solid lines are given by the theoretical model in the text. The inset shows the phase-matching behavior depending on the crystal temperature.
    Fig. 3. Conversion efficiency and undepletion rate as functions of the pump power. The MIR signal was set at the megawatt level, thus ensuring the fulfillment of the nondepleted pump approximation. The solid lines are given by the theoretical model in the text. The inset shows the phase-matching behavior depending on the crystal temperature.
    Detection efficiency and NEP versus the pump power for the implemented frequency upconversion detector. The input MIR signal was set at the single-photon level with an average photon number of 0.13 per pulse. The solid lines are given by the theoretical mode in the text. Count rates for the background noise are given in the inset.
    Fig. 4. Detection efficiency and NEP versus the pump power for the implemented frequency upconversion detector. The input MIR signal was set at the single-photon level with an average photon number of 0.13 per pulse. The solid lines are given by the theoretical mode in the text. Count rates for the background noise are given in the inset.
    PNR performance for the MIR frequency upconversion detector based on a Si-MPPC. (a) Superimposed waveforms of the MPPC signal recorded by a digital oscilloscope; (b) histogram of the photoresponse voltage amplitude for the upconverted SFG pulses. The solid lines represent the Gaussian fits, while the numbers denote the corresponding photon-number states. (c) Photon-number distribution reconstructed from the results shown in (b). The obtained statistics are fitted by Poisson distribution, indicating an average photon number of 2.55 per pulse. (d) Detected average photon number as a function of the incident average photon number. The slope of the fitted linear line implies a detection efficiency of 4.8%.
    Fig. 5. PNR performance for the MIR frequency upconversion detector based on a Si-MPPC. (a) Superimposed waveforms of the MPPC signal recorded by a digital oscilloscope; (b) histogram of the photoresponse voltage amplitude for the upconverted SFG pulses. The solid lines represent the Gaussian fits, while the numbers denote the corresponding photon-number states. (c) Photon-number distribution reconstructed from the results shown in (b). The obtained statistics are fitted by Poisson distribution, indicating an average photon number of 2.55 per pulse. (d) Detected average photon number as a function of the incident average photon number. The slope of the fitted linear line implies a detection efficiency of 4.8%.
    Kun Huang, Yinqi Wang, Jianan Fang, Weiyan Kang, Ying Sun, Yan Liang, Qiang Hao, Ming Yan, Heping Zeng. Mid-infrared photon counting and resolving via efficient frequency upconversion[J]. Photonics Research, 2021, 9(2): 259
    Download Citation