• Spectroscopy and Spectral Analysis
  • Vol. 40, Issue 11, 3522 (2020)
Jun LIU1、1, Shao-qing LIANG1、1, Yan-rong LI1、1, Rong-rong QIN1、1, Tao-ran ZHANG1、1, Qiang YANG1、1, and Ling-tong DU1、1
Author Affiliations
  • 1[in Chinese]
  • 11. Postdoctoral Scientific Research Workstation of Safety Technology and Engineering, Taiyuan University of Technology, Taiyuan 030024, China
  • show less
    DOI: 10.3964/j.issn.1000-0593(2020)11-3522-08 Cite this Article
    Jun LIU, Shao-qing LIANG, Yan-rong LI, Rong-rong QIN, Tao-ran ZHANG, Qiang YANG, Ling-tong DU. Evaluation and Modifying of Multispectral Drought Severity Index[J]. Spectroscopy and Spectral Analysis, 2020, 40(11): 3522 Copy Citation Text show less
    The site and DEM of Shanxi province
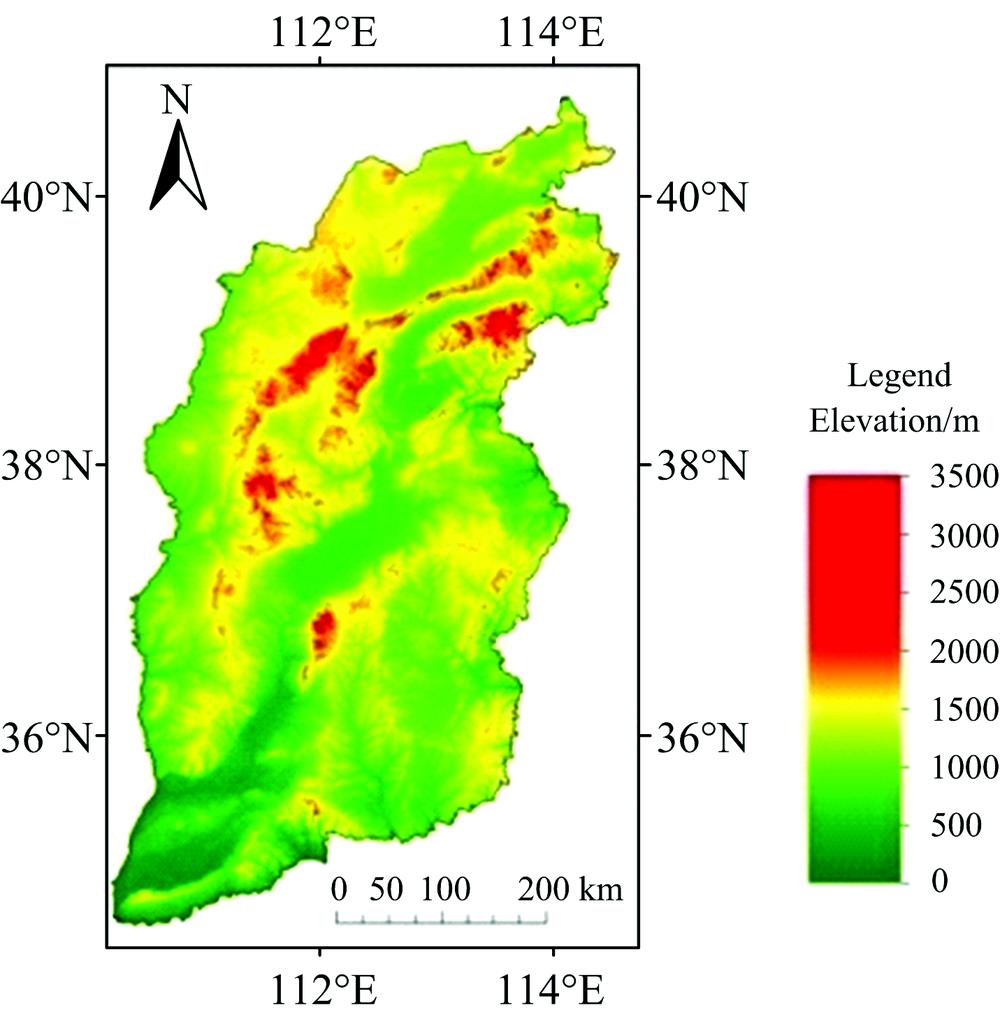
    Fig. 1. The site and DEM of Shanxi province
    Average yearly NDVI of Shanxi province from 2001 to 2014(a): MODIS NDVI; (b): AVHRR NDVI
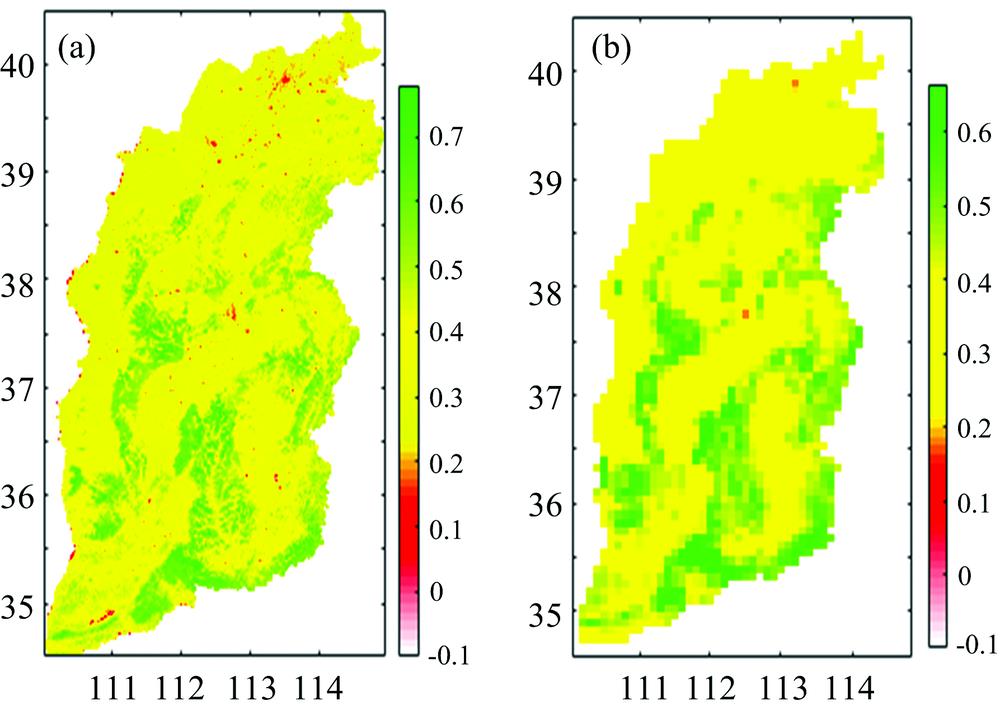
    Fig. 2. Average yearly NDVI of Shanxi province from 2001 to 2014
    (a): MODIS NDVI; (b): AVHRR NDVI
    Average monthly SPEI (a), DSIMODIS (b) and DSIAVHRR (c) in Shanxi province from 2001 to 2014
    Fig. 3. Average monthly SPEI (a), DSIMODIS (b) and DSIAVHRR (c) in Shanxi province from 2001 to 2014
    Correlation coefficients among DSIMODIS, DSIAVHRR and SPEI(a): SPEI and DSIMODIS; (b): SPEI and DSIAVHRR; (c): DSIMODIS and DSIAVHRR
    Fig. 4. Correlation coefficients among DSIMODIS, DSIAVHRR and SPEI
    (a): SPEI and DSIMODIS; (b): SPEI and DSIAVHRR; (c): DSIMODIS and DSIAVHRR
    Time frequency of drought under D1~D4 gradesin Shanxi Province from 2001 to 2014(a): SPEI; (b): DSIMODIS; (c): DSIMM
    Fig. 5. Time frequency of drought under D1~D4 gradesin Shanxi Province from 2001 to 2014
    (a): SPEI; (b): DSIMODIS; (c): DSIMM
    Spatial rate of SPEI, DSIMODIS and DSIMM under D1~D4 (a, b, c, d) grades
    Fig. 6. Spatial rate of SPEI, DSIMODIS and DSIMM under D1~D4 (a, b, c, d) grades
    Drought information of four seasons in Shanxi province from 2001 to 2014 year
    Fig. 7. Drought information of four seasons in Shanxi province from 2001 to 2014 year
    Typical drought monitoring in summer of 2001 (a) and 2002 (b) based on DSIMM
    Fig. 8. Typical drought monitoring in summer of 2001 (a) and 2002 (b) based on DSIMM
    数据集名称数据集说明时空分辨率时间跨度变量名称
    MODISModerate resolution imaging spectroradiometer500 m 16 d
    250 m 8 d
    250 m 8 d
    2001—2014
    2001—2014
    2001—2014
    NDVI
    ET
    PET
    CRUClimate research unit0.5°Monthly
    0.5°Monthly
    2001—2014
    2001—2014
    PR
    TA
    AVHRRAdvanced very high resolution radiometer8 km semi-monthly2001—2014NDVI
    Table 1. Data sets used for research
    类别描述SPEIDSI
    原始分类
    DSIMODIS
    修正分类DSIMM
    (本研究)
    D1轻度干旱≤-0.0≤-0.3≤0.0
    D2中度干旱≤-1.0≤-0.9≤-2.5
    D3重度干旱≤-1.5≤-1.2≤-2.7
    D4极度股旱≤-2.0≤-1.5≤-2.8
    Table 2. Criteria drought grading of DSI
    方案类别描述分类标准
    1D1轻度干旱≤-0.0
    D2中度干旱≤-2.2
    D3重度干旱≤-2.4
    D4极度干旱≤-2.6
    2D1轻度干旱≤-0.0
    D2中度干旱≤-2.4
    D3重度干旱≤-2.7
    D4极度干旱≤-2.8
    3D1轻度干旱≤-0.0
    D2中度干旱≤-2.5
    D3重度干旱≤-2.7
    D4极度干旱≤-2.8
    4D1轻度干旱≤-0.0
    D2中度干旱≤-3.0
    D3重度干旱≤-3.2
    D4极度干旱≤-3.3
    Table 3. Modification schemes based on time frequency of DSI
    Jun LIU, Shao-qing LIANG, Yan-rong LI, Rong-rong QIN, Tao-ran ZHANG, Qiang YANG, Ling-tong DU. Evaluation and Modifying of Multispectral Drought Severity Index[J]. Spectroscopy and Spectral Analysis, 2020, 40(11): 3522
    Download Citation