
Jinghua JIANG, Xuewu CAO. Simulation study of tritium atmospheric dispersion of loss of vacuum accident of a fusion reactor[J]. NUCLEAR TECHNIQUES, 2023, 46(2): 020605
- NUCLEAR TECHNIQUES
- Vol. 46, Issue 2, 020605 (2023)
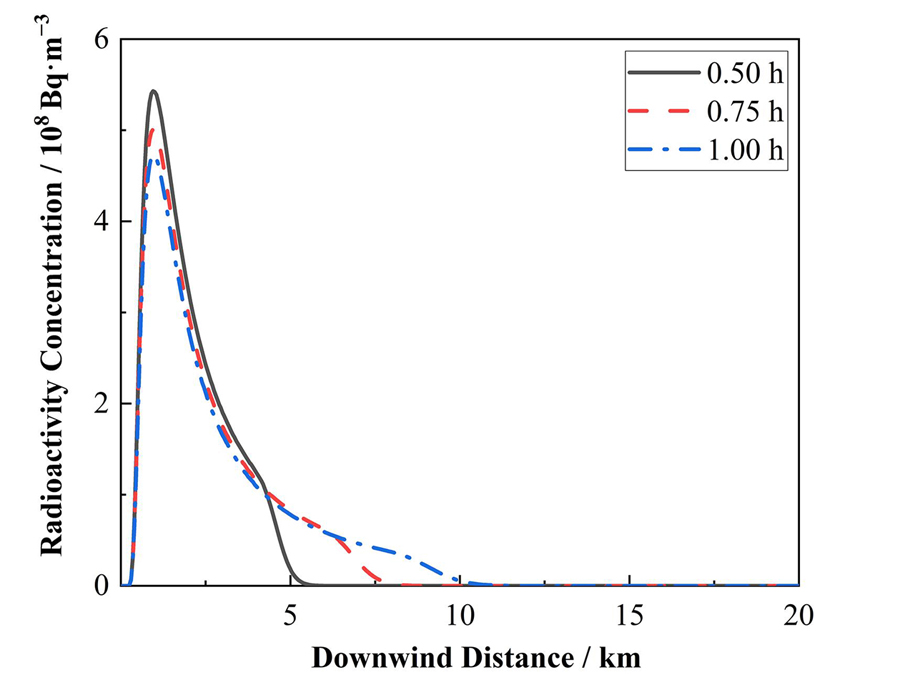
Fig. 1. Distribution of near-surface radioactivity concentration along the downwind direction during the mixed release phase
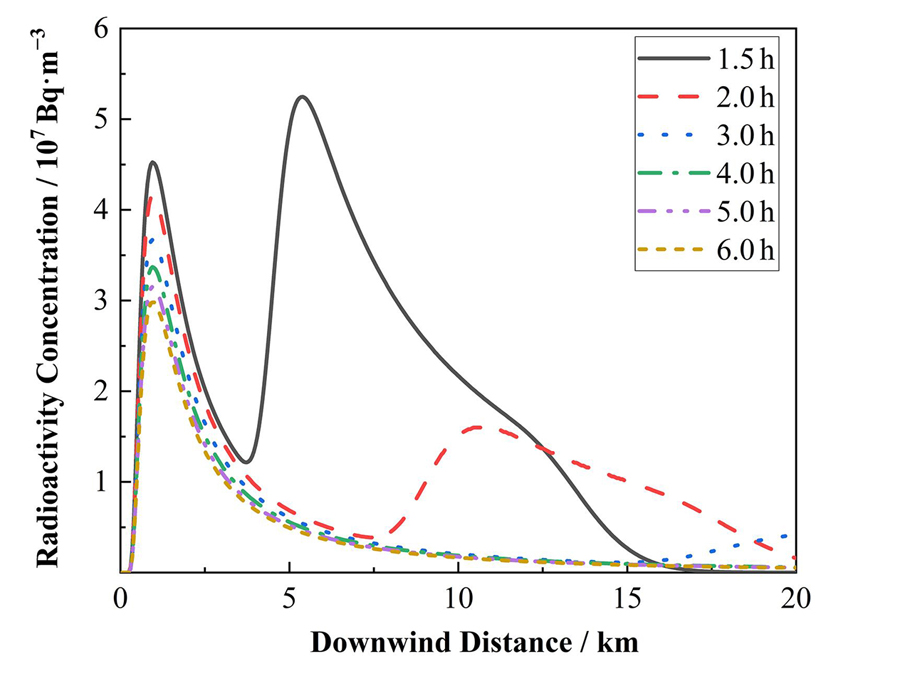
Fig. 2. Distribution of near-surface radioactivity concentrations along the downwind direction during the individual release phase
Fig. 3. Nephogram of radioactive concentration distribution (a) 1.5 h, (b) 2 h, (c) 3 h, (d) 4 h, (e) 5 h, (f) 6 h
Fig. 4. Variation of near ground level radioactivity concentration at different wind speeds (950 m)
Fig. 5. Distribution of near-surface radioactivity concentration at different wind speeds (t=2 h)
Fig. 6. Distribution of near-surface radioactivity concentration at different release heights (t=2 h)
Fig. 7. Near-ground radioactivity concentration at various locations at different release heights(a) Downwind 500 m, (b) Downwind 1 000 m, (c) Downwind 2 000 m, (d) Downwind 5 000 m
| |||||||||||||||||||||||||||
Table 1. Wind profile coefficient m value[15]
|
Table 2. Input parameters of the steady-state computational model
|
Table 3. Comparison of steady-state calculation results and experimental data
|
Table 4. Transient calculation model input parameters
|
Table 5. Comparison of transient calculation results and experimental data
|
Table 6. Input parameters for loss of vacuum accident analysis model
|
Table 7. Release characteristics of tritium


Set citation alerts for the article
Please enter your email address

© Copyright 2018-2021 | Chinese Laser Press. All Rights Reserved 沪ICP备15018463号-20