
Hongcheng Ji, Pinhua Xie, Jin Xu, Ang Li, Zhaokun Hu, Yeyuan Huang, Xin Tian, Xiaomei Li, Bo Ren, Hongmei Ren. Measuring Method of Atmospheric Carbon Dioxide Based on Tunable Fabry-Perot Interferometer[J]. Acta Optica Sinica, 2021, 41(18): 1812004
- Acta Optica Sinica
- Vol. 41, Issue 18, 1812004 (2021)
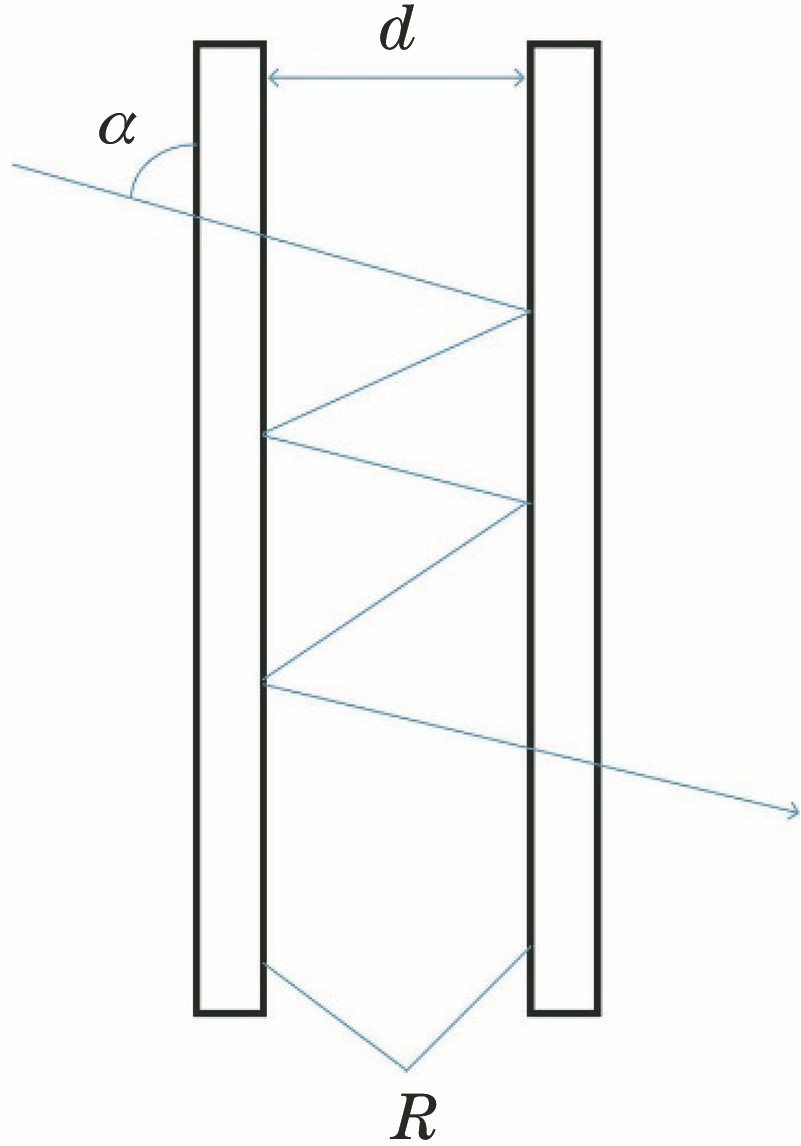
Fig. 1. Schematic diagram of optical path in FPI
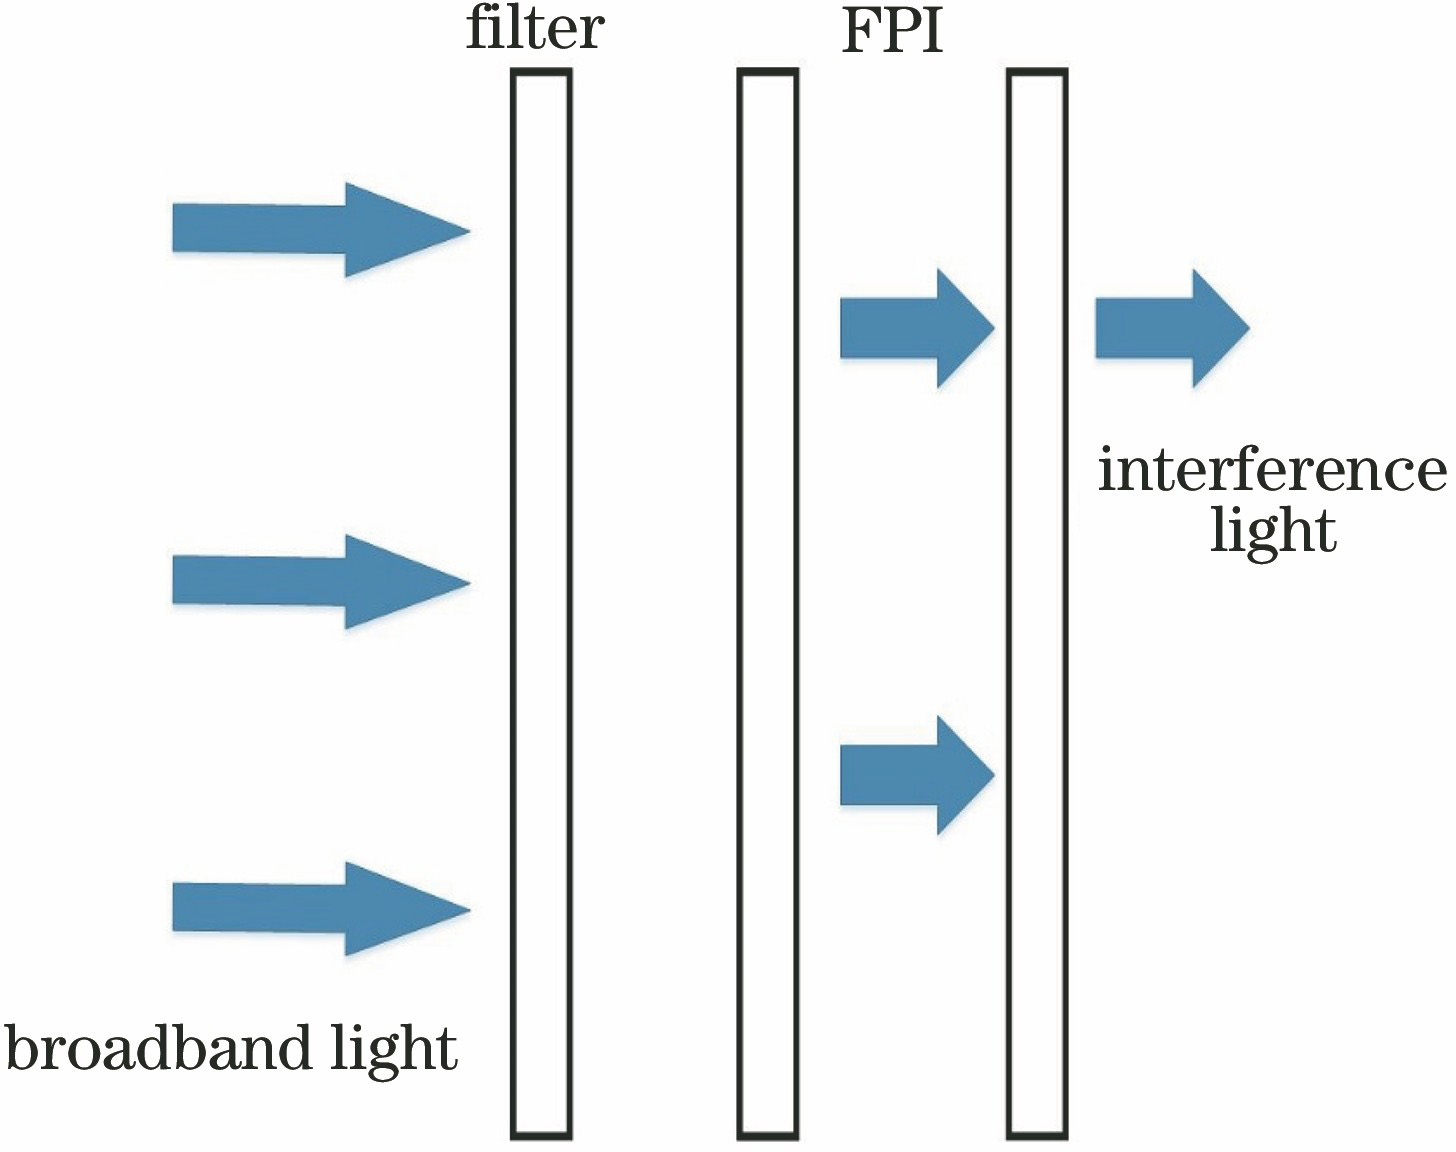
Fig. 2. Schematic diagram of filtering light by FPI
Fig. 3. Interference peaks at different central wavelengths of FPI under different driving voltages
Fig. 4. Operation flow chart of system
Fig. 5. Measured lamp spectrum and absorption spectra. (a) Measured lamp spectrum and absorption spectrum; (b) absorption spectrum with slight fluctuation
Fig. 6. Measured dark spectrum
Fig. 7.
Fig. 8. Structural diagram of gas measuring instrument based on tunable FPI sensor
Fig. 9. Lamp spectra at different modulation frequencies
Fig. 10. Dark spectra at modulation frequencies of 10 Hz and 20 Hz
Fig. 11. Non-sequential simulation of optical path by ZEMAX. (a) Magnification of detector end; (b) magnification of lens end
Fig. 12. Principle block diagram of system
Fig. 13. Physical diagram of system
Fig. 14. Inversion examples of spectra for CO2 with concentration of 9.9×10⁻⁵. (a) Absorption spectrum and fitted spectrum; (b) residual spectrum after fitting
Fig. 15. Changes of lamp spectra before and after introduction of nitrogen
Fig. 16. Time series of concentrations of CO2
Fig. 17. Frequency distributions of concentrations of CO2
Fig. 18. Linear fitting between measured value after iterative inversion and nominal value
Fig. 19. Concentration distributions of CO2 at different dates in 2021 measured by outfield experiment
Fig. 20. Concentration distributions of CO2 at different times in 2021
|
Table 1. FWHMs of interference peaks corresponding to center wavelengthes of FPI
| |||||||||||||||||||||||||||||||||||
Table 2. Average concentration values of different inversion channels under different concentrations of CO2
| |||||||||||||||||||||||||||||||||||
Table 3. Fitting errors of different inversion channels under different concentrations of CO2
|
Table 4. Nominal values and measured values by direct inversion of concentration of CO2

Set citation alerts for the article
Please enter your email address
© Copyright 2018-2021 | Chinese Laser Press. All Rights Reserved 沪ICP备15018463号-20