
Tian-shun LIU, Peng-fa LI, Gui-long LI, Meng WU, Ming LIU, Kai LIU, Zhong-pei LI. Using Three-Dimensional Excitation-Emission Matrix to Study the Compositions of Dissolved Organic Matter in the Rhizosphere Soil of Continuous Cropping Peanuts With Different Health States[J]. Spectroscopy and Spectral Analysis, 2022, 42(2): 634
- Spectroscopy and Spectral Analysis
- Vol. 42, Issue 2, 634 (2022)
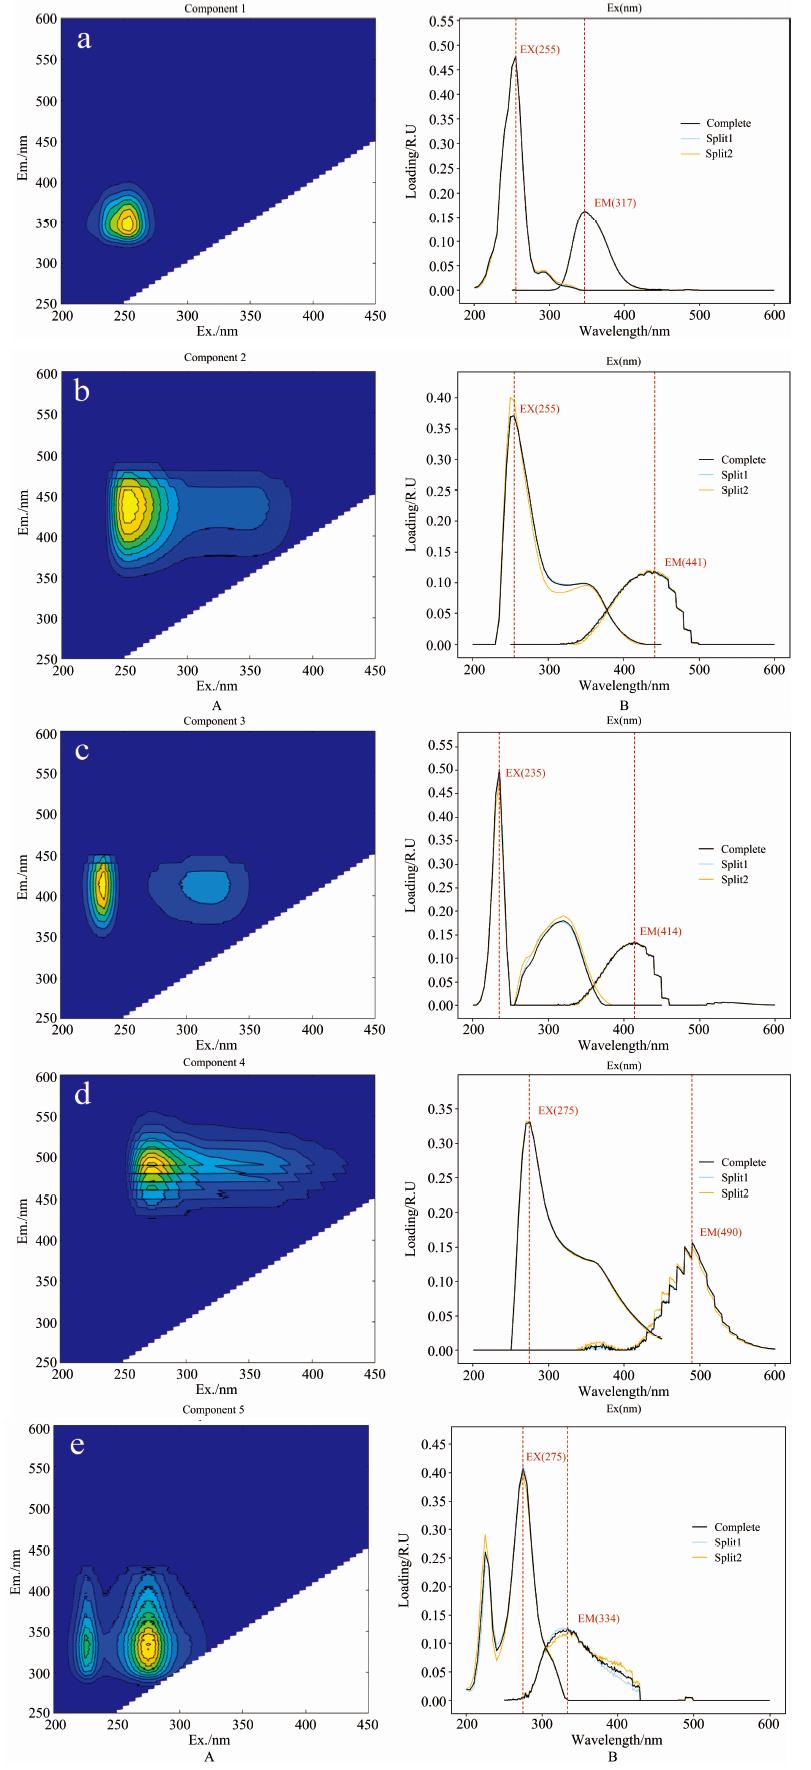
Fig. 1. Output of DOM components fluorescent signatures from PARAFAC model and validation results of the components: Left (A); Right (B)
The A shows the five fluorescence components, including (a): C1 tryptophan-like, (b): C2 fulvic-like, (c): C3 microbial-humic-like, (d): C4 humic-like, (e): C5 tyrosine*like, outputted from PARAFAC model. The B shows the split-half verification results corresponding to the components; excitation (left) and emission (right) loading spectra were estimated from two random halves of data set (Split1-blue line and Split2-orange line), and the complete data set (black line)
The A shows the five fluorescence components, including (a): C1 tryptophan-like, (b): C2 fulvic-like, (c): C3 microbial-humic-like, (d): C4 humic-like, (e): C5 tyrosine*like, outputted from PARAFAC model. The B shows the split-half verification results corresponding to the components; excitation (left) and emission (right) loading spectra were estimated from two random halves of data set (Split1-blue line and Split2-orange line), and the complete data set (black line)
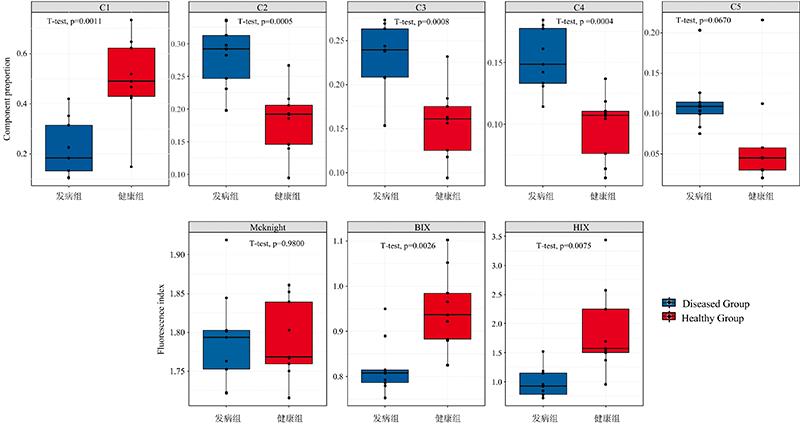
Fig. 2. Differences in fluorescence properties between groups
Note: C1 tryptophan-like, C2 fulvic-like, C3 microbial-humic-like, C4 humic-like, C5 tyrosine-like Mcknight, BIX biological origin index; HIX humification index
Note: C1 tryptophan-like, C2 fulvic-like, C3 microbial-humic-like, C4 humic-like, C5 tyrosine-like Mcknight, BIX biological origin index; HIX humification index
Fig. 3. Principal coordinate axis analysis of fluorescent property
Fig. 4. Correlations between fluorescent property of DOM with peanut biomass and soil properties
Fig. 5. Variation partitioning analysis on the composition of DOM
|
Table 1. Peanut biomass and basic properties of rhizosphere soils

Set citation alerts for the article
Please enter your email address
© Copyright 2018-2021 | Chinese Laser Press. All Rights Reserved 沪ICP备15018463号-20