• Laser & Optoelectronics Progress
  • Vol. 60, Issue 24, 2430001 (2023)
Yansong Yue1、2、3, Zhushanying Zhang1、2、3、*, Sicong Zhu1、2、3, Huimin Cao1、2、3, Dongyun Zheng1、2、3, and Qinlan Xie1、2、3
Author Affiliations
  • 1School of Biomedical Engineering, South-Central Minzu University, Wuhan 430074, Hubei, China
  • 2Key Laboratory of Cognitive Science, State Ethnic Affairs Commission, South-Central Minzu University, Wuhan 430074, Hubei, China
  • 3Hubei Key Laboratory of Medical Information Analysis and Tumor Diagnosis&Treatment, Wuhan 430074, Hubei, China
  • show less
    DOI: 10.3788/LOP231035 Cite this Article Set citation alerts
    Yansong Yue, Zhushanying Zhang, Sicong Zhu, Huimin Cao, Dongyun Zheng, Qinlan Xie. Influencing Factors of Mid-Infrared Spectrum Blood Glucose Detection[J]. Laser & Optoelectronics Progress, 2023, 60(24): 2430001 Copy Citation Text show less
    Original measurement spectra. (a) Model 1; (b) model 2; (c) model 3; (d) model 4
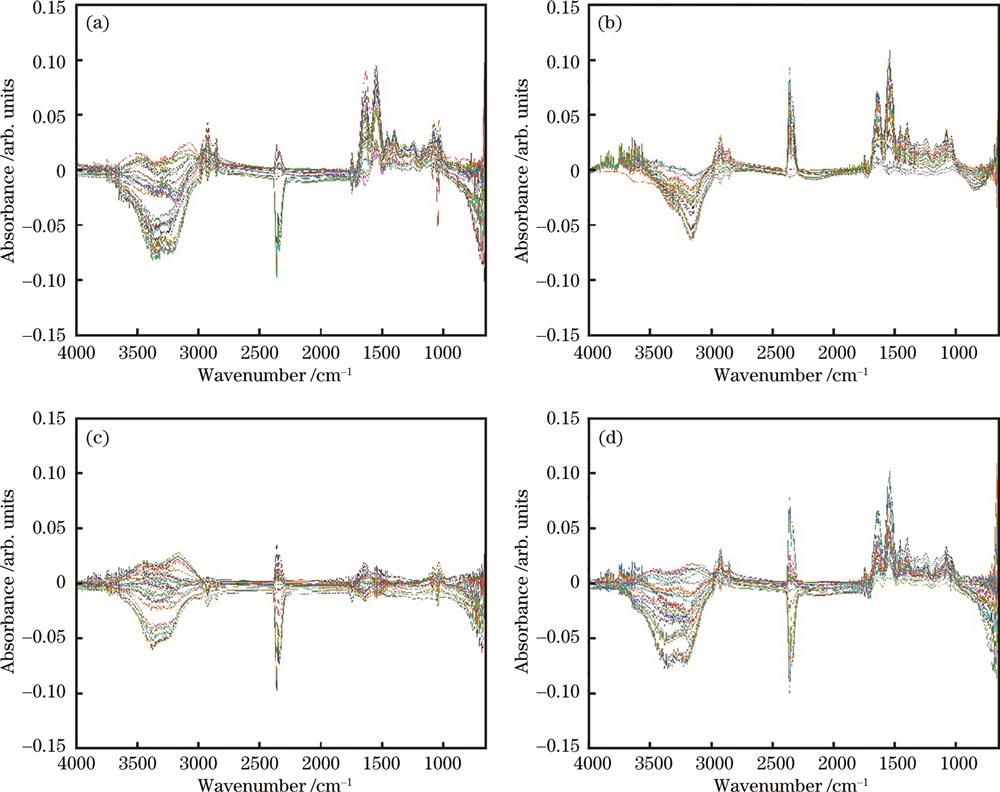
    Fig. 1. Original measurement spectra. (a) Model 1; (b) model 2; (c) model 3; (d) model 4
    Flow chart of mid-infrared spectroscopy glucose detection modeling and analysis
    Fig. 2. Flow chart of mid-infrared spectroscopy glucose detection modeling and analysis
    SG smooth spectra. (a) Model 1; (b) model 2; (c) model 3; (d) model 4
    Fig. 3. SG smooth spectra. (a) Model 1; (b) model 2; (c) model 3; (d) model 4
    Clarke Error Grid based on four subset models. (a) Model 1; (b) model 2; (c) model 3; (d) model 4
    Fig. 4. Clarke Error Grid based on four subset models. (a) Model 1; (b) model 2; (c) model 3; (d) model 4
    Predicted values versus true values. (a) Model 1; (b) model 2; (c) model 3; (d) model 4
    Fig. 5. Predicted values versus true values. (a) Model 1; (b) model 2; (c) model 3; (d) model 4
    IndexGlucoseAlbuminUreaCholesterol
    Mass concentration0‒4800‒60000‒900‒200
    Mass concentration gradient2020003050
    Table 1. Mass concentration range of substances
    Sample numberComposition
    14.00 mL 10% intralipid solutions
    20.25 mL ethanol and 3.75 mL 10% intralipid solutions
    30.50 mL ethanol and 3.50 mL 10% intralipid solutions
    40.75 mL ethanol and 3.25 mL 10% intralipid solutions
    51.00 mL ethanol and 3.00 mL 10% intralipid solutions
    Table 2. Composition of background solution samples
    ModelRMSECVfRpRMSEP
    139.7370100.978540.0187
    217.7817120.9042175.7292
    325.1170120.9616103.6627
    453.6867140.974238.6716
    Table 3. Model performance metrics based on different subsets
    ModelABCDE
    185.7%14.3%
    240.0%40.0%20.0%
    342.9%42.9%14.3%
    4100.0%
    Table 4. Percentage of points for different models located in corresponding areas of the Clarke Error Grid
    Yansong Yue, Zhushanying Zhang, Sicong Zhu, Huimin Cao, Dongyun Zheng, Qinlan Xie. Influencing Factors of Mid-Infrared Spectrum Blood Glucose Detection[J]. Laser & Optoelectronics Progress, 2023, 60(24): 2430001
    Download Citation