• Laser & Optoelectronics Progress
  • Vol. 59, Issue 13, 1316002 (2022)
Tuerxun·Ayinuremu1、2, Lei Wang1、2, Jilili·Subiyinuer1、2, and Sidike·Aierken1、2、*
Author Affiliations
  • 1School of Physics and Electronic Engineering, Xinjiang Normal University, Urumqi 830054, Xinjiang , China
  • 2Xinjiang Key Laboratory for Luminescence Minerals and Optical Functional Materials, Urumqi 830054, Xinjiang , China
  • show less
    DOI: 10.3788/LOP202259.1316002 Cite this Article Set citation alerts
    Tuerxun·Ayinuremu, Lei Wang, Jilili·Subiyinuer, Sidike·Aierken. Effect of Charge-Compensator Li+ Doping on Luminescence Performance of CaMgSiO4∶Sm3+ Red-Emitting Phosphor[J]. Laser & Optoelectronics Progress, 2022, 59(13): 1316002 Copy Citation Text show less
    Phase analysis of sample. (a) XRD patterns of CaMgSiO4∶2% Sm3+, y% Li+(y = 0, 0.5, 1, 1.5, 2); (b) crystal structure of CaMgSiO4
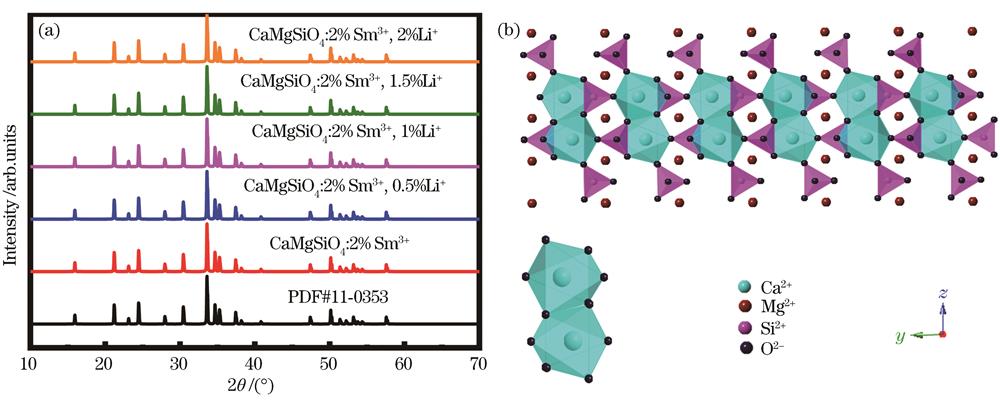
    Fig. 1. Phase analysis of sample. (a) XRD patterns of CaMgSiO4∶2% Sm3+, y% Li+(y = 0, 0.5, 1, 1.5, 2); (b) crystal structure of CaMgSiO4
    Variation of unit cell parameters of CaMgSiO4∶2% Sm3+, y% Li+(y = 0, 0.5, 1, 1.5, 2) with doping concentration of Li+. (a) Variation of a; (b) variation of b; (c) variation of c; (d) variation of v
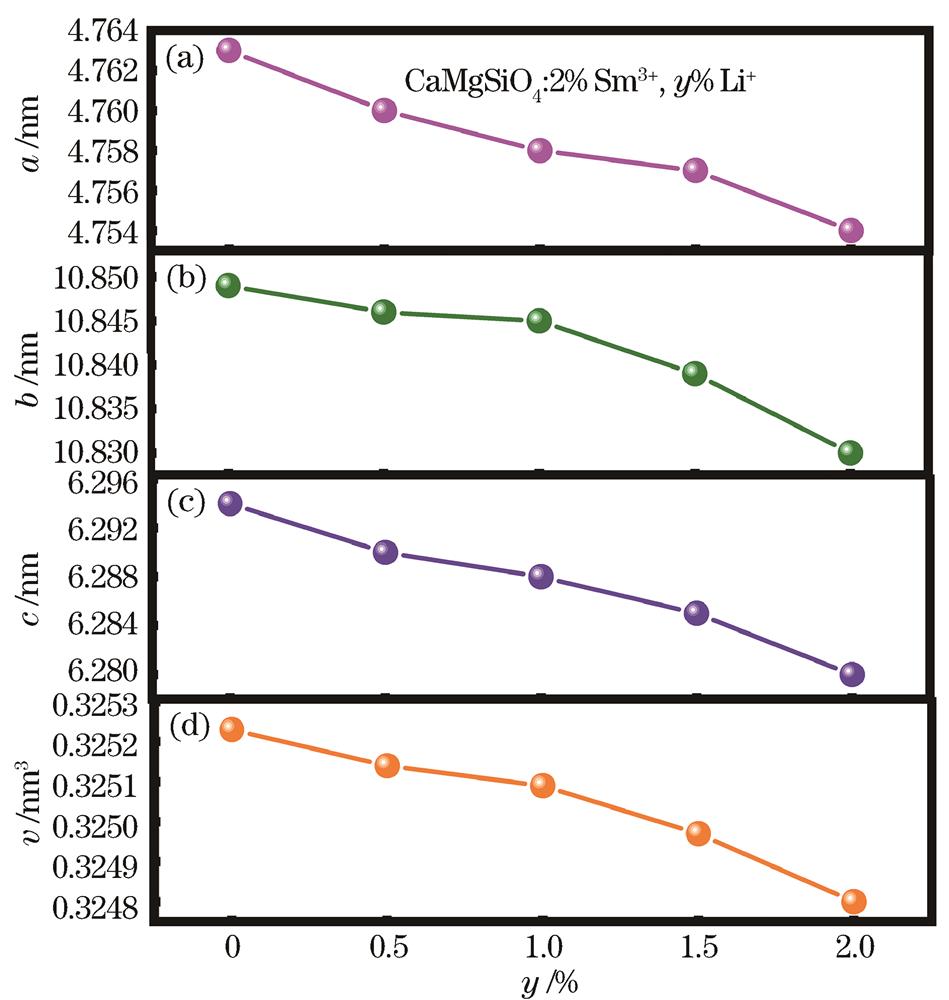
    Fig. 2. Variation of unit cell parameters of CaMgSiO4∶2% Sm3+, y% Li+(y = 0, 0.5, 1, 1.5, 2) with doping concentration of Li+. (a) Variation of a; (b) variation of b; (c) variation of c; (d) variation of v
    Morphology analysis of CaMgSiO4∶2% Sm3+ phosphor. (a)~(b) SEM image; (c) EDS and mol fraction of atoms of each element
    Fig. 3. Morphology analysis of CaMgSiO4∶2% Sm3+ phosphor. (a)~(b) SEM image; (c) EDS and mol fraction of atoms of each element
    Fluorescence spectra of CaMgSiO4∶x% Sm3+(x = 1, 1.5, 2, 2.5) phosphor samples. (a) Excitation spectra; (b) emission spectra
    Fig. 4. Fluorescence spectra of CaMgSiO4x% Sm3+(x = 1, 1.5, 2, 2.5) phosphor samples. (a) Excitation spectra; (b) emission spectra
    Concentration quenching mechanism diagram of CaMgSiO4∶ x% Sm3+(x = 1, 1.5, 2, 2.5)
    Fig. 5. Concentration quenching mechanism diagram of CaMgSiO4x% Sm3+(x = 1, 1.5, 2, 2.5)
    Fluorescence performance of CaMgSiO4∶2% Sm3+, y% Li+. (a) Emission spectra of CaMgSiO4∶2% Sm3+ and CaMgSiO4∶2% Sm3+, 1.5% Li+ phosphors; (b) relationship between integrated area at 601 nm in emission spectrum of CaMgSiO4∶2% Sm3+, y% Li+ and concentration of Li+
    Fig. 6. Fluorescence performance of CaMgSiO4∶2% Sm3+, y% Li+. (a) Emission spectra of CaMgSiO4∶2% Sm3+ and CaMgSiO4∶2% Sm3+, 1.5% Li+ phosphors; (b) relationship between integrated area at 601 nm in emission spectrum of CaMgSiO4∶2% Sm3+, y% Li+ and concentration of Li+
    Life decay curves and emission mechanism. (a) Life decay curves of CaMgSiO4∶2% Sm3+, y% Li+ samples at 601 nm; (b) emission mechanism of CaMgSiO4∶Sm3+ phosphors
    Fig. 7. Life decay curves and emission mechanism. (a) Life decay curves of CaMgSiO4∶2% Sm3+, y% Li+ samples at 601 nm; (b) emission mechanism of CaMgSiO4∶Sm3+ phosphors
    Color coordinates of CaMgSiO4∶2% Sm3+, 1.5% Li+ sample, illustrated as photos of 365 nm excitation of fluorescent lamps and near-ultraviolet lamps
    Fig. 8. Color coordinates of CaMgSiO4∶2% Sm3+, 1.5% Li+ sample, illustrated as photos of 365 nm excitation of fluorescent lamps and near-ultraviolet lamps
    Normalized peak intensities of CaMgSiO4∶2% Sm3+, 1.5% Li+ sample as a function of temperature
    Fig. 9. Normalized peak intensities of CaMgSiO4∶2% Sm3+, 1.5% Li+ sample as a function of temperature
    Chemical formula of raw materialPurityProduction company
    CaCO399.99%Shanghai Aladdin Biochemical Technology Co.,Ltd.
    MgO99.99%Shanghai Aladdin Biochemical Technology Co.,Ltd.
    SiO299.99%Shanghai Aladdin Biochemical Technology Co.,Ltd.
    Sm2O399.90%Shanghai Aladdin Biochemical Technology Co.,Ltd.
    Li2CO399.99%Shanghai Aladdin Biochemical Technology Co.,Ltd.
    Table 1. Main raw materials of CaMgSiO4∶Sm3+, Li+ phosphor
    Experimental methodTest instrument name(or software name)
    Phase analysisShimadzu XRD-6100 powder diffractometer
    Scanning electron microscope Energy dispersion spectrum

    JSM-7610F plus emission scanning electron microscope

    X-MaxN energy spectrometer

    Photoluminescence spectrum(lifetime)FLS920 steady/transient fluorescence spectrometer,Edinburgh,UK

    Thermal stability

    Color coordinates

    FLS980 high temperature fluorescent CIE 1931 color space
    Table 2. Test method and instrument parameters
    Tuerxun·Ayinuremu, Lei Wang, Jilili·Subiyinuer, Sidike·Aierken. Effect of Charge-Compensator Li+ Doping on Luminescence Performance of CaMgSiO4∶Sm3+ Red-Emitting Phosphor[J]. Laser & Optoelectronics Progress, 2022, 59(13): 1316002
    Download Citation