- Spectroscopy and Spectral Analysis
- Vol. 42, Issue 6, 1666 (2022)
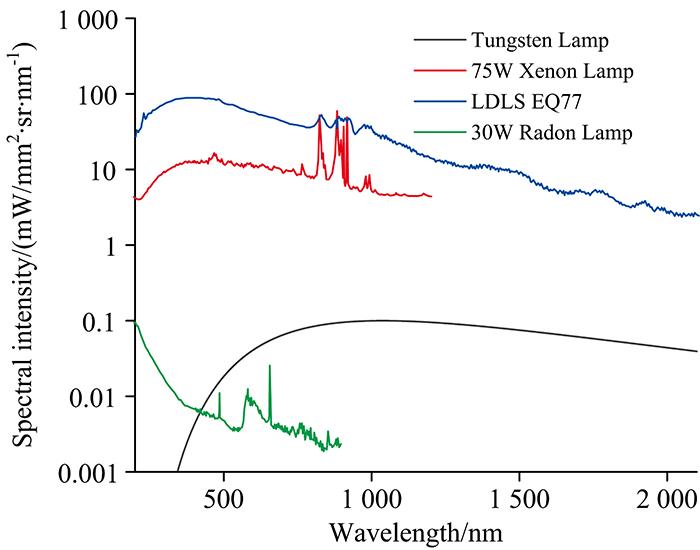
Fig. 1. Spectral intensity and coverage band comparison of different sources
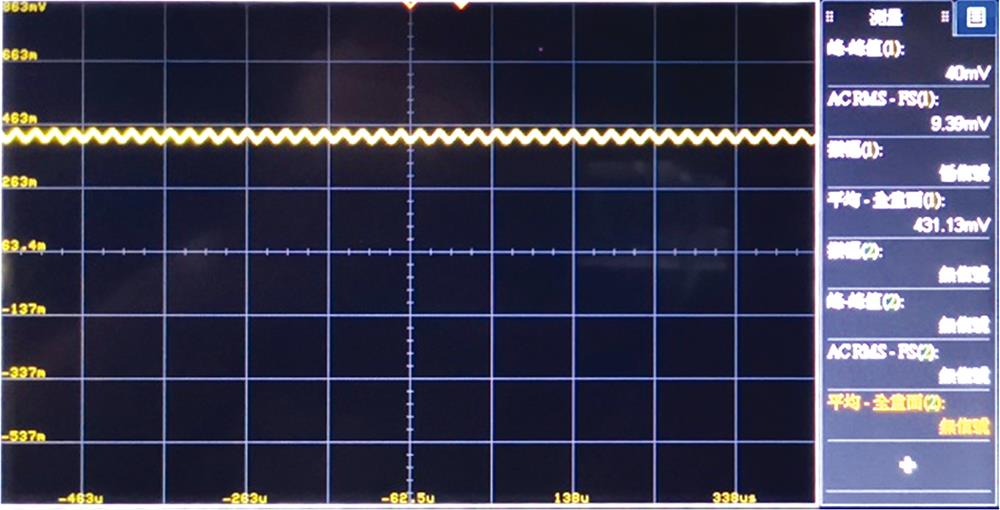
Fig. 2. Photosignal and frequency of LDLS
Fig. 3. Optical path of near-infrared Fourier transform spectrometer
Fig. 4. Near-infrared Fourier transform spectrometer system
(a): Light source high-frequency modulated by using chopper; (b): LDLS system
(a): Light source high-frequency modulated by using chopper; (b): LDLS system
Fig. 5. Detector background noise without light signal input
Fig. 6. The spectral comparison results with different integration times of the lock-in amplifier
(a): Integration time=20 ms; (b): Integration time=10 ms; (c): Integration time=5 ms;(d): Integration time=1 ms; (e): Integration time=0.5 ms; (f): SNRI vs integration time
(a): Integration time=20 ms; (b): Integration time=10 ms; (c): Integration time=5 ms;(d): Integration time=1 ms; (e): Integration time=0.5 ms; (f): SNR
Fig. 7. Fourier transform interference spectral results with LDLS
(a): Without demodulation; (b): With demodulation
(a): Without demodulation; (b): With demodulation
Fig. 8. Spectral SNRI before and after replacing the light source
Fig. 9. The near-infrared standard sample absorption spectra measured with LDLS Fourier transform spectral system
(a): Fourier transformation spectra with and without standard sample; (b): near-infrared Fourier transformation spectra with background removed
(a): Fourier transformation spectra with and without standard sample; (b): near-infrared Fourier transformation spectra with background removed
|
Table 1. The equipment and model required for the experiment
|
Table 2. Near-infrared peak and bandwidth of standard sample
|
Table 3. Comparison of standard peaks and test peaks

Download Citation

Set citation alerts for the article
Please enter your email address
© Copyright 2018-2021 | Chinese Laser Press. All Rights Reserved 沪ICP备15018463号-20