Kai Lin, Xinhong Jia, Huiliang Ma, Cong Xu, Xuan Zhang, Lei Ao. Comparative study on reduced impacts of Brillouin pump depletion and nonlinear amplification in coded DBA-BOTDA[J]. Chinese Optics Letters, 2018, 16(9): 090604
Copy Citation Text
The impacts of Brillouin pump depletion and nonlinear amplification in coded long-range Brillouin optical time-domain analysis (BOTDA) based on distributed Brillouin amplification (DBA) were studied. The error of Brillouin frequency shift (BFS) due to Brillouin pump depletion was compared for DBA-BOTDA using non-cyclic and cyclic coding. For non-cyclic coding, significant over- and under-shoots of BFS were found in the range with larger BFS variation, such as hot spot. The impact of Brillouin pump depletion can be reduced considerably by cyclic coding. Furthermore, to compensate the BFS error due to nonlinear amplification, a simple and effective log linearization was proposed and demonstrated.
As a type of distributed fiber sensor[1–24], Brillouin optical time-domain analysis (BOTDA) has made great progress and been widely used in fire alarms and the structure for health monitoring of oil pipelines, rail transportation, power cables, and so on. For standard BOTDA, the maximum available pulse peak power is limited by nonlinear effects, such as modulating instability (MI)[4] and self-phase modulation (SPM)[5]. Moreover, the upper limit of probe input power is restricted by the non-local effect[6]. These problems result in the lower signal-to-noise ratio (SNR) for long-distance sensing. In order to overcome the above problems, mono-color[7–14] and color[15] optical pulse coding (OPC) and distributed optical amplification[16–24] have been proposed.
According to the pulse generation way, mono-color OPC in BOTDA can be divided into non-cyclic[7–10] and cyclic coding[11–14]. For non-cyclic coding, pulse sequence at each line of the coding matrix is generated one by one. For cyclic coding, the pulse sequence is generated continuously in a cyclic way. Recently, BOTDA with 1 m spatial resolution using 79 bits cyclic coding along a 164 km fiber loop and an sensing fiber has been reported[14]. However, further coding length increase is limited by the significant exponential amplification of the probe light[14].
On the other hand, use of distributed Raman amplification (DRA)[16–19] and distributed Brillouin amplification (DBA)[20–24] for BOTDA has been extensively studied for enhancing the performance of BOTDA. Compared with DRA, DBA has some advantages in terms of high-efficiency amplification and being free of transfer of relative intensity noise (RIN)[20–24]. Recently, first-order DBA-BOTDA using an optical-comb pump and non-cyclic coding was proposed by the authors[21]. To obtain a more uniform gain distribution, we also generalized this structure to second-order pumping, BOTDA sensing along standard single-mode fiber (SMF) has been achieved[23]. In DBA-BOTDA, the pulses in each coding sequence are unevenly amplified. This phenomenon is caused by the depletion of Brillouin pump from pulse light, which limits the maximal coding length. In our experiment, a shorter coding length of 15 bits has to be used[21,23]. In previous DBA-BOTDA reports, only non-cyclic coding was used[21,23], and a comparison on the effect of Brillouin pump depletion for non-cyclic and cyclic coding has not been involved.
Sign up for Chinese Optics Letters TOC. Get the latest issue of Chinese Optics Letters delivered right to you!Sign up now
In this Letter, a quantitative comparative study was given on the sensing influence of Brillouin pump depletion in coded DBA-BOTDA sensors using cyclic and non-cyclic coding. Results show that, for non-cyclic coding, significant over- and under-shoots of Brillouin frequency shift (BFS) were found in the range with BFS variation, such as a hot spot. The pulse gain fluctuation due to pump depletion can be reduced considerably by cyclic coding.
Furthermore, considering that even the effect of pump depletion can be reduced by cyclic coding, a residual BFS error was found due to nonlinear amplification[14], and a simple and effective log linearization compensation was utilized for DBA-BOTDA. Experimental results supported its effectiveness. Note that in this work, the use of first-order rather than second-order DBA was simpler and more cost-effective.
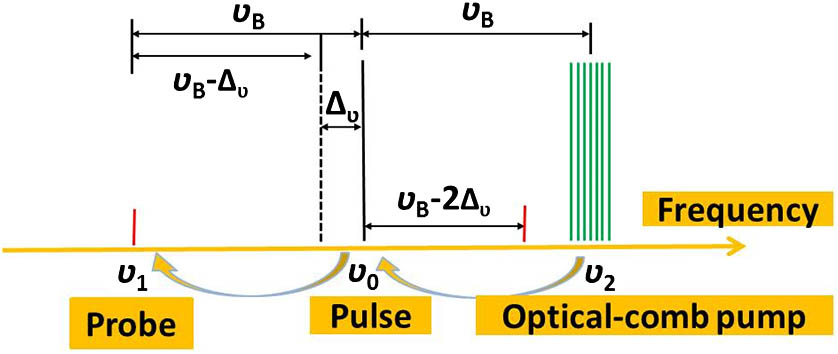
The operation principle is shown in Fig. 1, where , , and are the central frequencies of the pulse, probe light, and optical-comb pump. Here, the optical comb used to amplify the pulse light is called a “Brillouin pump”. Considering the frequency shift of the acoustic-optic modulator (AOM) (), the frequency of microwave source 2 (MWS2) in experimental setup should be swept around , where () is the BFS of the fiber under test (FUT). In our work, the scanning frequency ranges from 10,600 to 10,710 MHz with 5 MHz steps. The frequency of MWS1 (frequency shift of the Brillouin pump relative to the optical source) is fixed at . The power of the Brillouin pump is slightly changed to ensure the transparency transmission for pulse light.
Figure 1.Principle diagram of DBA-BOTDA with optical-comb pump. The position of the dotted line denotes the frequency of the optical source.
We now give the physical mechanism of pulse gain fluctuation due to Brillouin pump depletion by numerical simulation. Figure 2 shows the schematic diagram of Brillouin pump depletion for coded DBA-BOTDA using non-cyclic and cyclic coding. The Brillouin pump and coded pulse light are assumed to be injected into the fiber at and , respectively. For non-cyclic coding, when the pulse (, is the coding length) propagates to the position , the Brillouin pump that interacts with this pulse at position has undergone the depletion from pulse () at the position of , where , is the coding interval of adjacent pulses, and is the group velocity. This leads to the exponential gain saturation with the increased , as shown in Fig. 2(a). However, for cyclic coding, since the coded pulses are injected in a continuous way, the Brillouin pump that interacts with pulse at position has undergone the depletion from the pulse to , where is the fiber length, and is the maximal integer that is less than or equal to . Although the detailed pump depletion depends on the code pattern, the total number and energy of the pulses that deplete the Brillouin pump are similar, leading to more uniform Brillouin amplification, as shown in Fig. 2(b).
Figure 2.Schematic diagram of Brillouin pump depletion for coded DBA-BOTDA using (a) non-cyclic and (b) cyclic coding. is the pulse interval. The dots denote the interaction positions. For example, the black dots are the positions where the Brillouin pump has undergone the depletion when the fourth pulse arrives at .
The evolution of peak power of coded pulses is given by where is the time, , is the fiber loss coefficient, (, ) is the Brillouin pump power, t = /vg + (i − 1)Tp, g(, ) and are the spatial distributions of the Brillouin gain coefficient and peak power of pulse . The distribution of Brillouin pump power when it interacts with pulse is described by where is the input Brillouin pump power at , and is the spatial resolution. In this model, we assume that the non-local effect due to pulse depletion from the probe light is negligible. Besides, due to the considered pulsewidth () and (not less than 100 ns), the Brillouin transient gain caused by the limited phonon relaxation time can be approximately ignored.
The iteration method is used in numerical simulations. Firstly, () is simulated by neglecting the pump depletion from pulse 1 according to Eq. (2). This approximation is reasonable because generally the depletion from a single pulse is very small. () can be calculated according to Eq. (1). Secondly, () is achieved by considering the depletion from () in Eq. (2), where pump depletion from () is approximately omitted. () is then obtained from Eq. (1). In this way, all of the pulse peak power () can be modeled. We have verified that the simulation results using this model are in agreement with the coupled equations of stimulated Brillouin scattering (SBS)[25], but computation time is shortened largely in the long-distance case.
Figure 3 gives the simulated power distributions of Brillouin pump and coded pulses. The parameters used include , , for bit 1, , , , and or 1134.3 m for non-cyclic and cyclic coding, respectively. is extracted from the measurement, and other values are the same as the experimental conditions in Figs. 5 and 6. It is clear that the non-cyclic coding shows larger gain fluctuation. The normalized output peak power of coded pulses is shown in Figs. 3(e) and 3(f). The simulated pulse power fluctuations for non-cyclic and cyclic coding are and 11.8%, respectively.
Figure 3.Numerical results for pulse gain fluctuation due to pump depletion. (a), (b) Distribution of Brillouin pump. (c), (d) Distribution of coded pulse peak power. (e), (f) Normalized output peak power of coded pulses. (a), (c), (e) are for non-cyclic coding, and (b), (d), (f) are for cyclic coding.
Figure 5.(a) Pulse waveforms after EDFA3. (b) Transmitted pulse waveforms at different pulse peak powers with DBA. (c) 3D BGS near the hot spot at pulse peak power of 15 dBm. (d) BGS at the rising edge of the hot spot. Non-cyclic coding is used.
Figure 6.(a) Pulse waveforms after EDFA3. (b) Transmitted pulse waveforms at different pulse peak powers with DBA. (c) 3D BGS near the hot spot at pulse peak power of 15 dBm. (d) BGS at the rising edge of the hot spot. Cyclic coding is used.
The experimental setup of coded first-order DBA-BOTDA with an optical-comb pump is shown in Fig. 4. The setup is similar to that in Ref. [21] except that the comparison of non-cyclic and cyclic coding is performed, and compensation of nonlinear amplification is considered. A beam light from a distributed feedback laser diode (DFB-LD) at 1549.2 nm is divided into Brillouin pump, probe, and pulse lights through two couplers. The pump is generated by electro-optic modulator 1 (EOM1). EOM1 is biased at its carrier suppression point and driven by the mixed microwave signal, which comes from MWS1 and electrical frequency combs. Tunable bandpass filter 1 (TBPF1) with bandwidth [realized by a fiber Bragg grating (FBG) and a circulator] is used to suppress the low-frequency sideband and residual carrier. The bandwidth of Brillouin gain from the pump is widened sufficiently via optical combs to reduce the distortion of the coded pulses. TBPF2 is used to suppress the amplified spontaneous emission (ASE) of erbium-doped fiber amplifier 1 (EDFA1).
The probe light is generated by EOM2, which is also biased at its carrier suppression point and driven by MWS2. EDFA2 is introduced to further amplify the probe light. The Brillouin pump and probe light are injected into the FUT after combination. The coded pulse is generated by an AOM driven by an arbitrary waveform generator (AWG). EDFA3 is used to amplify the pulse light. In order to suppress the polarization-dependent gain noise, two polarization scramblers (PS1 and PS2) are used for probe and pulse lights, respectively. EOM1 and EOM2 are stabilized by two modulator bias controllers (Plugtech, MBC-MZM-01 A).
At the receiver end, TBPF3 is inserted to suppress the pump, high-frequency sideband of the probe light, and Rayleigh scattering. EDFA4 is inserted to further amplify the attenuated probe light. TBPF4 is used to reduce ASE of EDFA4. Finally, the converted electronic signal by a photodetector (PD1) with 100 MHz bandwidth is acquired by a data acquisition card (DAQ) operating at 100 MSa/s sampling rate. The waveform output of the pulse train is monitored using an oscilloscope (OSC) in real-time.
Various coding patterns can be used, such as periodic Simplex code[11–13,26], pseudorandom binary sequence (PRBS)[27], and code with a recurrence equation shown in Refs. [14,15]. In this work, we generate the coded pulse train using that introduced in Refs. [14,15], where the coding length is a prime number. The interval of the neighboring bit slots is 100 ns to overcome the restriction of acoustic lifetime[7–9]. To perform a fair comparison, the same coding matrix is used for both non-cyclic and cyclic coding. The total average times for cyclic coding are 6700. To ensure the similar total average times, the pre-average times for non-cyclic coding are adjusted correspondingly. The length of FUT (SMF) is . The time duration of cyclic coding should be close to the roundtrip time of FUT[12–14] and is set to 760 μs. The frequencies of optical-comb pump include , , , and . The pulsewidth is used, corresponding to spatial resolution. The rising time and extinction ratio of the AOM are 8 ns and 52 dB, respectively. To suppress the non-local effect, the injected probe power is set to .
To minimize the gain saturation caused by EDFA3[10] in Fig. 4, we place variable optical attenuator 3 (VOA3) before EDFA3 in order to control its input power. Figures 5(a) and 6(a) show the waveforms after EDFA3 for non-cyclic and cyclic coding with pulse peak power of 15 dBm. The coding length is 67 bits. The pulse gain fluctuation [defined as , where and are the maximal and minimal peak powers of pulses] due to transient amplification of EDFA3 is and 1.6% for non-cyclic and cyclic coding, respectively.
Figures 5(b) and 6(b) show the transmitted pulse waveforms after FUT at different pulse peak powers. For non-cyclic coding, pulse gain fluctuation is intensified from to 66.9% when its peak power is increased from 9 to 15 dBm. Note that the contribution of Brillouin pump depletion to pulse gain fluctuation is far larger than that due to EDFA3 saturation. For cyclic coding, the gain ripple is much smaller than that of non-cyclic coding. As shown in Fig. 6(b), the gain fluctuations are to 13.3% at pulse peak powers of 9 and 15 dBm, respectively. The pulse gain fluctuation at pulse peak power of 15 dBm is close to the simulation result in Figs. 3(e) and 3(f). A small discrepancy may be caused by the neglected gain saturation of EDFA3.
Figures 5(c) and 6(c) show the three-dimensional (3D) Brillouin gain spectrum (BGS) near a hot spot at the pulse peak power of 15 dBm. The BGS at the rising edge of the hot spot is depicted in Figs. 5(d) and 6(d) for non-cyclic and cyclic coding. The length and temperature of the hot spot are and 60°C, respectively. For non-cyclic coding, a significant dip is found at the middle position (74.189 km). Note that the frequency shift of this dip is the same as the BFS of the front fiber, which means a cross-talk of sensing information. This observation is attributed to the pulse gain fluctuation, leading to a BFS error after Lorentz fitting. By comparison, for cyclic coding, no dip is found at the middle position of the hot spot.
The extracted BFSs near the hot spot for various pulse peak powers are displayed in Fig. 7(a). The pulse gain fluctuations are summarized in Fig. 7(b). It is seen that when the pulse peak power is 9 dBm, the BFS distributions of both non-cyclic and cyclic coding are similar, which means a smaller decoding error. As the pulse peak power increased beyond 15 dBm, non-cyclic coding shows the strong over- and under-shoots at the rising and falling edges of the hot spot. For instance, at pulse peak power of 18 dBm, over-shoot and under-shoot are found for non-cyclic coding in comparison with BFS at pulse peak power of 9 dBm. The distortion of BFS due to Brillouin pump depletion can be clearly reduced for cyclic coding. Figures 7(c) and 7(d) show the normalized Brillouin traces with different pulse peak powers at 10,845 MHz. Although the higher pulse peak power enables the enhanced SNR, the under-shoots at the end of FUT are more pronounced for non-cyclic coding. The extracted BFSs near the hot spot for different coding lengths are shown in Fig. 8(a). The pulse gain fluctuations are shown in Fig. 8(b). The pulse peak power is 14 dBm. When the coding length is increased from 17 to 139 bits, the gain fluctuation of non-cyclic coding is worsened from 28.1% to 88.3%. For cyclic coding, the gain fluctuation is less than . For non-cyclic coding, the over-shoot of BFS shown in Fig. 8(a) is more visible for coding length. For instance, when the coding length is 139 bits, over-shoot and under-shoot are found in comparison with BFS at 17 bits.
Figure 7.(a) Extracted BFS distributions near the hot spot for various pulse peak powers. The squared and dotted lines are for non-cyclic and cyclic coding, respectively. (b) Pulse gain fluctuations for various peak powers. (c), (d) Brillouin responses with different pulse peak powers at 10,845 MHz. (c) and (d) are for non-cyclic and cyclic coding, respectively. The magnified view of the over-shoot is shown in the inset of (a).
Figure 8.(a) Extracted BFS near the hot spot for various coding lengths. The squared and dotted lines are for non-cyclic and cyclic coding, respectively. (b) Pulse gain fluctuations for various coding lengths. The magnified view of the over-shoot is shown in the inset of (a).
From Figs. 7 and 8, although the BFS error induced by pump depletion can be reduced considerably by using cyclic coding, some smaller BFS errors can be found. More specifically, for cyclic coding, BFS difference can be observed by comparison at pulse peak powers of 9 and 18 dBm [see Fig. 7(a)], and difference can be observed at 17 and 139 bits [see Fig. 8(a)]. This error is mainly caused by the nonlinear amplification[14]. Theoretically, the output of probe light at as a function of can be described by an equivalent form with[14]where , and is the input probe power at .
For standard linear approximation, the intensity variation of is considered to be proportional to the linear superposition of pulse Brillouin responses[12,14]. A larger system error would be generated for higher powers of pulse peak and Brillouin pump, wide pulse duration, and longer coding length, as shown in Eq. (3). Here, we newly use the well-known log linearization to reduce the error due to nonlinear amplification by performing a log operation on the two sides of Eq. (3). The detailed steps include: (1) the direct-current (DC) component due to the residual ASE beating from EDFA4 (see Fig. 4) is measured by simply turning off the probe beam; (2) the frequency of MWS2 is swept, trace pre-average is carried out, and then the DC optical component should be subtracted; (3) a log operation is performed to get a linear combination of Brillouin responses of the coded sequence; (4) decoded traces are obtained by solving the deconvolution equation set (see Ref. [11]).
Figures 9(a) and 9(b) describe the 3D BGS near the hot spot using linear approximation and log linearization, respectively, in which the pulse peak power of 14 dBm and cyclic coding length of 509 bits are used. By comparison, the Brillouin response intensity of the hot spot is decreased significantly for linear approximation due to the decoding error caused by nonlinear amplification. Also, the measured BGS linewidth before the hot spot [for instance, 74.131 km in Fig. 9(c)] is narrowed compared with that of log linearization. In Fig. 9(d), the fitted BFSs near the hot spot are depicted when changing the pulse peak power from 9 to 18 dBm. The coding length is 251 bits. The maximal BFS error at the hot spot using linear approximation is (resulting from the incorrect Lorentz fitting due to the highly distorted BGS) at pulse peak power of 18 dBm (compared with that at 9 dBm). By using log linearization, the BFS error of the hot spot is reduced to .
Figure 9.3D BGS near the hot spot using (a) linear approximation and (b) log linearization. (c) BGS at 74.131 km (dotted) and 74.190 km (squared) using linear approximation (red) and log linearization (blue). (d) BFS distributions near the hot spot for different pulse peak powers. Cyclic coding is used.
Finally, we performed the sensing experiment along an SMF based on cyclic coding and log linearization. The coding length, pulse peak power, and Brillouin pump power are 509 bits, 14 dBm, and 3.5 dBm, respectively. The room temperature is . The measured SNR enhancement due to coding is , which is close to the theoretical value according to [11–14]. The measured pulse gain fluctuation is after EDFA3 and at the output with DBA. The pulse depletion across the swept frequencies is , meaning that the non-local effect is sufficiently suppressed due to lower probe input ().
The 3D BGS is shown in Fig. 10(a). The BFS distribution after Lorentz fitting is shown in Fig. 10(b). Note that the slight increase of BFS at the far end of FUT is due to the intrinsic BFS variation. Fig. 10(c) shows the distribution of standard deviation by nine times of repeated measurements (no hot spot is introduced in this case). The maximal standard deviation of the BFS is . Figure 10(d) reports the variation of BFS near the hot spot with increased temperature of the hot spot. The rising and falling distances are and 6 m, respectively. The averaged spatial resolution is . The temperature sensitivity for our used FUT is by linear fitting.
Figure 10.Distributions of (a) 3D BGS, (b) BFS along FUT, (c) standard deviation, and (d) BFS near the hot spot for various temperatures. In (a) and (b), the temperature of the hot spot is 60°C.
Kai Lin, Xinhong Jia, Huiliang Ma, Cong Xu, Xuan Zhang, Lei Ao. Comparative study on reduced impacts of Brillouin pump depletion and nonlinear amplification in coded DBA-BOTDA[J]. Chinese Optics Letters, 2018, 16(9): 090604