• Spectroscopy and Spectral Analysis
  • Vol. 41, Issue 2, 592 (2021)
Cheng WANG1、1, Hang YU1、1, Wei-rong YAO1、1, Yu-liang CHENG1、1, Ya-hui GUO1、1, He QIAN1、1, Zhi-qiang TAN1、1, and Yun-fei XIE1、1
Author Affiliations
  • 1[in Chinese]
  • 11. School of Food Science and Technology, Jiangnan University, Wuxi 214122, China
  • show less
    DOI: 10.3964/j.issn.1000-0593(2021)02-0592-07 Cite this Article
    Cheng WANG, Hang YU, Wei-rong YAO, Yu-liang CHENG, Ya-hui GUO, He QIAN, Zhi-qiang TAN, Yun-fei XIE. A Study on the Screening of Anti-Inflammatory Drug Diclofenac Sodium in Dietary Supplements by Near Infrared Hyperspectral Imaging[J]. Spectroscopy and Spectral Analysis, 2021, 41(2): 592 Copy Citation Text show less
    Mean original spectra of Diclofenac Sodium, Anti-inflammatory dietary supplements (KB), different concentrations of diclofenac sodium compounds (No.1—20) in inflammation-reducing dietary supplements
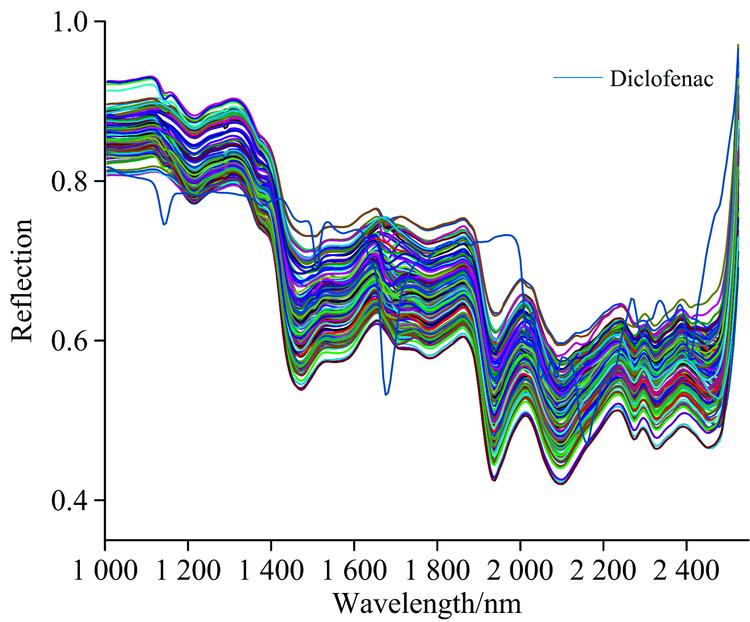
    Fig. 1. Mean original spectra of Diclofenac Sodium, Anti-inflammatory dietary supplements (KB), different concentrations of diclofenac sodium compounds (No.1—20) in inflammation-reducing dietary supplements
    Hyperspectral images of 0.01%~20% Diclofenac sodium in anti-inflammatory dietary supplements (KB), anti-inflammatory dietary supplements and Diclofenac sodium (Diclofenac) at 1 675 nm
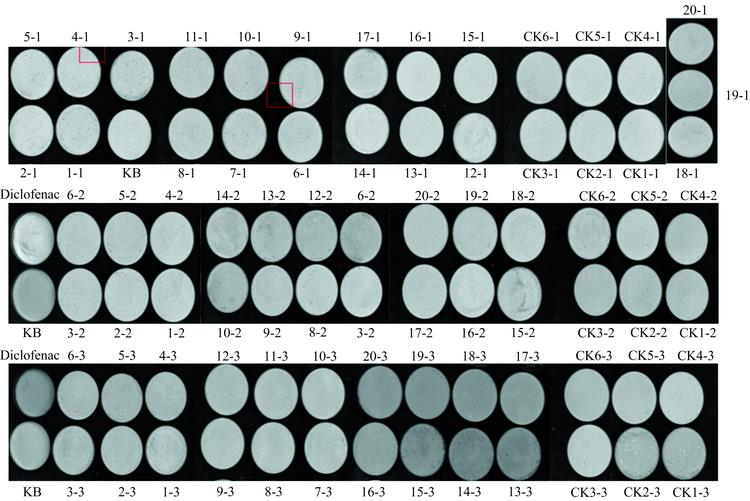
    Fig. 2. Hyperspectral images of 0.01%~20% Diclofenac sodium in anti-inflammatory dietary supplements (KB), anti-inflammatory dietary supplements and Diclofenac sodium (Diclofenac) at 1 675 nm
    Selection of the optimal spectral bands by weight ratio of β regression coefficients in the partial least squares regression (PLSR) model
    Fig. 3. Selection of the optimal spectral bands by weight ratio of β regression coefficients in the partial least squares regression (PLSR) model
    ModelPretreatmentCalibrationValidationPrediction
    LvsR2RMSECR2RMSECVR2RMSEPSEPBias
    PLSRRAW60.980 40.009 40.972 90.011 10.946 80.012 90.012 60.003 8
    Moving Average60.979 60.009 50.973 10.011 10.933 20.014 50.013 30.006 2
    Gaussian Filter60.980 20.009 40.973 50.011 00.892 60.013 40.012 70.004 5
    Median Filter60.980 00.009 50.974 50.010 90.947 30.012 90.012 70.003 0
    SG-Smoothing60.979 80.009 50.975 30.010 80.943 30.013 40.013 10.004 0
    Normalize40.988 00.007 30.983 90.008 40.971 20.009 50.008 20.005 0
    Baseline60.981 80.009 00.976 00.010 70.949 90.012 60.012 20.003 8
    SNV50.984 00.008 50.978 40.009 90.956 90.011 70.011 00.004 4
    MSC50.984 20.008 40.979 60.009 70.957 30.011 60.010 90.004 3
    Table 1. PLSR model based on full spectral wavelength
    ModelPretreatmentCalibrationValidationPrediction
    LvsR2RMSECR2RMSECVR2RMSEPSEPBias
    PCRRAW50.955 00.014 20.953 70.014 90.907 30.018 00.018 20.001 5
    Moving Average50.953 00.014 50.947 80.015 30.897 00.019 90.019 30.006 2
    Gaussian Filter50.954 50.014 30.951 80.015 00.874 20.018 40.018 50.002 4
    Median Filter50.954 40.014 30.949 40.015 10.892 60.018 20.018 20.003 1
    SG-Smoothing50.953 50.014 40.948 00.015 30.894 60.018 50.018 80.001 1
    Normalize40.985 10.022 60.984 20.023 40.891 40.024 40.024 70.000 0
    Baseline40.952 40.014 60.946 80.015 60.811 60.018 40.018 60.001 8
    SNV40.962 50.013 00.957 50.013 80.892 00.018 70.019 00.000 6
    MSC50.992 30.016 00.991 80.016 90.888 70.018 40.018 20.004 1
    Table 2. PCR model based on full spectral wavelength
    ModelpretreatmentCalibrationValidationPrediction
    R 2RMSECR 2RMSECVR 2(Pearson)RMSEPSEPBias
    MLRRAW0.9980.0040.991 80.006 10.987 10.006 40.006 50
    Moving Average0.998 50.003 60.993 30.005 40.972 10.023 70.011 90.020 6
    Gaussian Filter0.998 30.003 90.992 00.006 00.984 10.008 90.007 20.005 3
    Median Filter0.999 40.002 20.997 00.003 70.983 50.007 20.007 40
    SG-Smoothing0.998 60.003 50.992 90.005 60.969 00.041 00.015 10.038 3
    Normalize0.997 90.009 40.989 70.006 80.988 30.006 40.006 30.001 6
    Baseline0.998 30.003 90.992 00.006 00.986 30.006 70.006 7-0.000 9
    SNV0.999 00.002 90.995 60.004 40.992 80.004 90.004 9-0.000 4
    MSC0.999 10.002 70.996 30.004 10.991 80.005 40.005 3-0.001 4
    Table 3. MLR model based on optimal spectral band
    Modelpre-treatmentR2NameReference(W/W)Predicted(W/W)Deviation
    MLRSNV0.992 8CK10.000 50.002 60.004 4
    CK20.005 00.007 70.004 6
    CK30.015 00.014 20.004 3
    CK40.050 00.047 10.002 7
    CK50.110 00.111 40.003 0
    CK60.150 00.146 10.004 4
    PLSRNormalize0.971 2CK10.000 50.005 50.017 0
    CK20.005 0-0.001 80.018 1
    CK30.015 00.018 50.017 3
    CK40.050 00.056 90.019 7
    CK50.110 00.102 70.025 8
    CK60.150 00.134 30.015 7
    PCRRaw0.907 3CK10.000 50.018 40.025 7
    CK20.005 00.010 90.019 4
    CK30.015 00.019 20.015 0
    CK40.050 00.059 60.015 4
    CK50.110 00.099 50.018 4
    CK60.150 00.125 20.011 8
    Table 4. The predictive values of PLSR, PCR and MLR models compared with real value
    Cheng WANG, Hang YU, Wei-rong YAO, Yu-liang CHENG, Ya-hui GUO, He QIAN, Zhi-qiang TAN, Yun-fei XIE. A Study on the Screening of Anti-Inflammatory Drug Diclofenac Sodium in Dietary Supplements by Near Infrared Hyperspectral Imaging[J]. Spectroscopy and Spectral Analysis, 2021, 41(2): 592
    Download Citation